$567,500
-- bd|-- ba|3.5k sqft
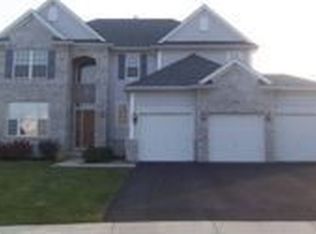
760 Boyce Rd, Sugar Grove, IL 60554
Off Market
Zillow last checked:
Listing updated:
Laura Henrikson, SRES 312-772-6879,
@properties Christie's International Real Estate
Not available
Estimated sales range
Not available
Not available
| Date | Event | Price |
|---|---|---|
| 3/30/2026 | Contingent | $430,000$138/sqft |
Source: | ||
| 3/27/2026 | Listed for sale | $430,000+22.9%$138/sqft |
Source: | ||
| 3/17/2023 | Listing removed | -- |
Source: Zillow Rentals Report a problem | ||
| 2/24/2023 | Listed for rent | $3,400+58.1%$1/sqft |
Source: Zillow Rentals Report a problem | ||
| 11/28/2022 | Sold | $350,000+7.7%$112/sqft |
Source: | ||
| 10/11/2017 | Listing removed | $324,900$104/sqft |
Source: Baird & Warner #09743309 Report a problem | ||
| 9/26/2017 | Listing removed | $2,150$1/sqft |
Source: Baird & Warner #09757637 Report a problem | ||
| 9/22/2017 | Listed for rent | $2,150$1/sqft |
Source: Baird & Warner #09757637 Report a problem | ||
| 8/24/2017 | Price change | $324,900-2.7%$104/sqft |
Source: Baird & Warner #09692141 Report a problem | ||
| 8/10/2017 | Price change | $333,900-1.8%$107/sqft |
Source: Baird & Warner #09692141 Report a problem | ||
| 7/27/2017 | Price change | $340,000-2.9%$109/sqft |
Source: Baird & Warner #09692141 Report a problem | ||
| 7/17/2017 | Listed for sale | $350,000$112/sqft |
Source: Baird & Warner #09692141 Report a problem | ||
| 9/1/2004 | Sold | $350,000$112/sqft |
Source: Public Record Report a problem | ||
| Year | Property taxes | Tax assessment |
|---|---|---|
| 2024 | $11,893 -4.1% | $140,109 +3.6% |
| 2023 | $12,396 +10.6% | $135,279 +8.3% |
| 2022 | $11,208 +3.7% | $124,888 +5.1% |
| 2021 | $10,805 +1.4% | $118,851 +2.2% |
| 2020 | $10,653 +1.6% | $116,315 +3.4% |
| 2019 | $10,490 -0.3% | $112,512 +2.1% |
| 2018 | $10,517 +3.1% | $110,178 +4.7% |
| 2017 | $10,197 -3.7% | $105,222 +4.6% |
| 2016 | $10,589 | $100,585 +7.5% |
| 2015 | -- | $93,585 +4.6% |
| 2014 | -- | $89,486 -1% |
| 2013 | -- | $90,426 -5% |
| 2012 | -- | $95,146 -7.8% |
| 2011 | -- | $103,173 -8.6% |
| 2010 | -- | $112,906 -4.4% |
| 2009 | -- | $118,053 -12.4% |
| 2008 | -- | $134,774 +0.1% |
| 2007 | -- | $134,680 +4.6% |
| 2006 | -- | $128,745 +7.7% |
| 2005 | -- | $119,585 +249.1% |
| 2004 | -- | $34,253 +1082.8% |
| 2003 | -- | $2,896 +2.2% |
| 2002 | -- | $2,833 |
Find assessor info on the county website
Source: MRED as distributed by MLS GRID. This data may not be complete. We recommend contacting the local school district to confirm school assignments for this home.
A local agent can set up tours, give advice and negotiate with sellers.