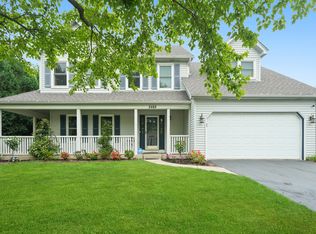
$426,900
-- bd|-- ba|-- sqft
Cheshire Dr, Aurora, IL 60504
Off Market
Zillow last checked:
Listing updated:
Subhapriya Lakshmanan, CSC 630-202-3957,
Charles Rutenberg Realty of IL
$497,200
$472,000 - $522,000
$3,182/mo
| Date | Event | Price |
|---|---|---|
| 4/15/2026 | Listed for sale | $510,000+71.7%$245/sqft |
Source: | ||
| 4/10/2017 | Sold | $297,000-5.4%$143/sqft |
Source: | ||
| 2/27/2017 | Pending sale | $314,000$151/sqft |
Source: john greene Realtor #09402163 Report a problem | ||
| 12/9/2016 | Price change | $314,000-1.9%$151/sqft |
Source: john greene Realtor #09402163 Report a problem | ||
| 9/21/2016 | Price change | $320,000-1.5%$154/sqft |
Source: john greene Realtor #09251894 Report a problem | ||
| 7/1/2016 | Price change | $325,000-1.5%$156/sqft |
Source: john greene Realtor #09251894 Report a problem | ||
| 6/9/2016 | Listed for sale | $330,000+13942.6%$159/sqft |
Source: john greene Realtor #09251894 Report a problem | ||
| 7/21/2012 | Listing removed | $2,350$1/sqft |
Source: ERA Naper Realty, Inc. #08042745 Report a problem | ||
| 5/17/2012 | Listed for sale | $2,350-99.3%$1/sqft |
Source: ERA Naper Realty, Inc. #08042745 Report a problem | ||
| 4/27/2005 | Sold | $320,000+58.8%$154/sqft |
Source: Public Record Report a problem | ||
| 6/6/1997 | Sold | $201,500+7.8%$97/sqft |
Source: Public Record Report a problem | ||
| 11/29/1993 | Sold | $187,000$90/sqft |
Source: Public Record Report a problem | ||
| Year | Property taxes | Tax assessment |
|---|---|---|
| 2024 | $9,557 +4.9% | $133,693 +11.3% |
| 2023 | $9,113 +2.6% | $120,130 +7.3% |
| 2022 | $8,884 +2.7% | $111,940 +3.7% |
| 2021 | $8,648 -1.2% | $107,940 |
| 2020 | $8,754 +3.7% | $107,940 +5.1% |
| 2019 | $8,444 -3.2% | $102,660 -2% |
| 2018 | $8,725 -4.3% | $104,780 +3.5% |
| 2017 | $9,120 +8.2% | $101,220 +4.2% |
| 2016 | $8,427 +1% | $97,140 +5.3% |
| 2015 | $8,341 -4.8% | $92,230 -1.9% |
| 2014 | $8,765 +1% | $93,970 -0.7% |
| 2013 | $8,674 +3.1% | $94,620 -2% |
| 2012 | $8,412 +2.5% | $96,580 -6.4% |
| 2011 | $8,207 +3.8% | $103,210 -2% |
| 2010 | $7,906 +3.1% | $105,270 -4% |
| 2009 | $7,671 +3% | $109,660 +1.8% |
| 2008 | $7,447 +4.4% | $107,720 +5.8% |
| 2007 | $7,132 +5.2% | $101,810 +7.4% |
| 2006 | $6,779 -0.3% | $94,800 +2.6% |
| 2005 | $6,802 +4.1% | $92,400 +3.8% |
| 2004 | $6,536 +3.3% | $89,020 +6.8% |
| 2003 | $6,326 +9.2% | $83,350 +8.4% |
| 2002 | $5,794 +4.3% | $76,920 +4.7% |
| 2001 | $5,554 +5.6% | $73,480 +4.4% |
| 2000 | $5,257 | $70,380 |
Source: MRED as distributed by MLS GRID. This data may not be complete. We recommend contacting the local school district to confirm school assignments for this home.
A local agent can set up tours, give advice and negotiate with sellers.
A local lender can help you make sure your offer is ready when you are.