$171,800
-- bd|-- ba|-- sqft
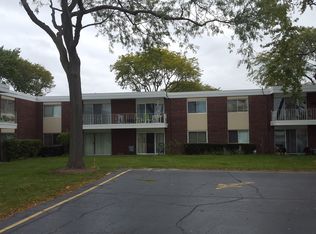
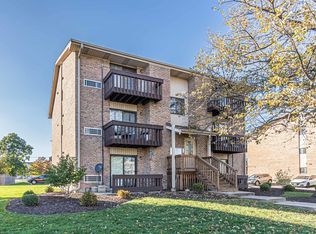
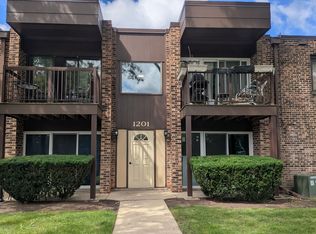
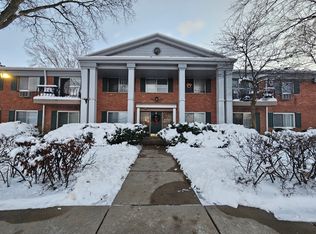
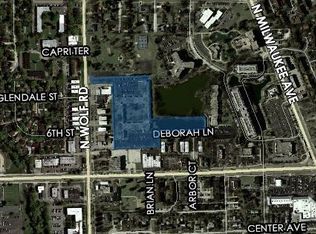
100 Deborah Ln APT A1, Wheeling, IL 60090
Off Market
Likely to sell faster than
Zillow last checked: 7 hours ago
Listing updated: April 03, 2026 at 07:18pm
Ewa Kocoj 773-745-1000,
Chicagoland Brokers, Inc.
Not available
Estimated sales range
Not available
Not available
| Date | Event | Price |
|---|---|---|
| 4/3/2026 | Listed for sale | $195,000+112%$195/sqft |
Source: | ||
| 7/28/2017 | Sold | $92,000-6%$92/sqft |
Source: | ||
| 7/18/2017 | Listed for sale | $97,900$98/sqft |
Source: My Chicago Realty Inc. #09693995 Report a problem | ||
| 2/22/2017 | Pending sale | $97,900$98/sqft |
Source: My Chicago Realty Inc. #09407574 Report a problem | ||
| 2/15/2017 | Price change | $97,900-2%$98/sqft |
Source: My Chicago Realty Inc. #09407574 Report a problem | ||
| 2/1/2017 | Price change | $99,900-3.8%$100/sqft |
Source: My Chicago Realty Inc. #09407574 Report a problem | ||
| 1/25/2017 | Price change | $103,900-1%$104/sqft |
Source: My Chicago Realty Inc. #09407574 Report a problem | ||
| 1/18/2017 | Price change | $105,000-3.7%$105/sqft |
Source: My Chicago Realty Inc. #09407574 Report a problem | ||
| 1/11/2017 | Listed for sale | $109,000+0.9%$109/sqft |
Source: My Chicago Realty Inc. #09407574 Report a problem | ||
| 9/4/2001 | Sold | $108,000+68.8%$108/sqft |
Source: Public Record Report a problem | ||
| 11/12/1996 | Sold | $64,000$64/sqft |
Source: Public Record Report a problem | ||
| Year | Property taxes | Tax assessment |
|---|---|---|
| 2023 | $2,299 +6.5% | $10,174 |
| 2022 | $2,159 +230% | $10,174 +99.6% |
| 2021 | $654 -9.1% | $5,096 |
| 2020 | $719 -3.5% | $5,096 -10.7% |
| 2019 | $745 +37% | $5,704 +15.8% |
| 2018 | $544 -1.9% | $4,926 |
| 2017 | $554 -31.6% | $4,926 |
| 2016 | $810 +47.6% | $4,926 +18.3% |
| 2015 | $549 -13.9% | $4,164 -5.4% |
| 2014 | $638 -24.4% | $4,403 +4.3% |
| 2013 | $843 -23.8% | $4,220 -31.9% |
| 2012 | $1,107 -6.8% | $6,201 |
| 2011 | $1,188 -28% | $6,201 -20% |
| 2010 | $1,649 +7.3% | $7,751 -28.2% |
| 2009 | $1,536 +9.4% | $10,790 -20.9% |
| 2008 | $1,404 +6.4% | $13,649 |
| 2007 | $1,319 -3.8% | $13,649 +40.5% |
| 2006 | $1,371 +9.2% | $9,718 |
| 2005 | $1,255 -37.6% | $9,718 |
| 2004 | $2,011 +26% | $9,718 +31.2% |
| 2003 | $1,596 +5.6% | $7,405 |
| 2002 | $1,511 +90.4% | $7,405 |
| 2001 | $794 +0.9% | $7,405 +23.4% |
| 2000 | $786 +4% | $5,999 |
| 1999 | $756 | $5,999 |
Source: MRED as distributed by MLS GRID. This data may not be complete. We recommend contacting the local school district to confirm school assignments for this home.