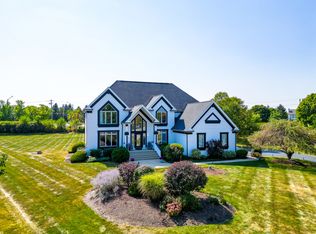
$890,000
4 bd|4 ba|3.9k sqft
5N871 Westwood Ln, St Charles, IL 60175
Sold

Zillow last checked: 8 hours ago
Listing updated: 11 hours ago
Marco L De Benedictis, ABR 708-205-1970,
Master Key Realty Inc.
Not available
Estimated sales range
Not available
Not available
| Date | Event | Price |
|---|---|---|
| 3/2/2026 | Listed for sale | $799,900$201/sqft |
Source: | ||
| 9/3/2025 | Listing removed | $799,900$201/sqft |
Source: | ||
| 8/28/2025 | Price change | $799,900-5.9%$201/sqft |
Source: | ||
| 8/17/2025 | Price change | $849,900-2.3%$213/sqft |
Source: | ||
| 8/9/2025 | Listed for sale | $869,900+19.2%$218/sqft |
Source: | ||
| 5/15/2023 | Sold | $730,000+2.2%$183/sqft |
Source: | ||
| 5/4/2023 | Pending sale | $714,100$179/sqft |
Source: | ||
| 4/10/2023 | Contingent | $714,100$179/sqft |
Source: | ||
| 4/7/2023 | Listed for sale | $714,100+43.5%$179/sqft |
Source: | ||
| 12/28/2020 | Sold | $497,500$125/sqft |
Source: Public Record Report a problem | ||
| 9/30/2020 | Sold | $497,500-3.4%$125/sqft |
Source: | ||
| 9/2/2020 | Pending sale | $514,999$129/sqft |
Source: Berkshire Hathaway HomeServices Elite Realtors #10816486 Report a problem | ||
| 8/22/2020 | Price change | $514,999-1%$129/sqft |
Source: Berkshire Hathaway HomeServices Elite Realtors #10816486 Report a problem | ||
| 8/6/2020 | Price change | $519,999-0.9%$130/sqft |
Source: Berkshire Hathaway HomeServices Elite Realtors #10816486 Report a problem | ||
| 7/14/2020 | Price change | $524,900-1.9%$132/sqft |
Source: Elite, REALTORS #10744540 Report a problem | ||
| 7/10/2020 | Price change | $534,900-0.5%$134/sqft |
Source: Elite, REALTORS #10744540 Report a problem | ||
| 6/12/2020 | Listed for sale | $537,600+4.4%$135/sqft |
Source: Berkshire Hathaway HomeServices Elite Realtors #10744540 Report a problem | ||
| 4/30/2013 | Sold | $515,000-7.2%$129/sqft |
Source: Public Record Report a problem | ||
| 7/9/2009 | Sold | $555,000-11.2%$139/sqft |
Source: Public Record Report a problem | ||
| 11/19/2002 | Sold | $625,000-6%$157/sqft |
Source: Public Record Report a problem | ||
| 5/18/2001 | Sold | $665,000+90%$167/sqft |
Source: Public Record Report a problem | ||
| 4/24/1995 | Sold | $350,000+158.3%$88/sqft |
Source: Public Record Report a problem | ||
| 11/28/1994 | Sold | $135,500$34/sqft |
Source: Public Record Report a problem | ||
| Year | Property taxes | Tax assessment |
|---|---|---|
| 2024 | $15,129 +4.8% | $221,707 +11.7% |
| 2023 | $14,433 +2.7% | $198,431 +4.6% |
| 2022 | $14,051 +2.5% | $189,688 +4.9% |
| 2021 | $13,710 +0.2% | $180,810 -1.8% |
| 2020 | $13,683 +1.8% | $184,154 +2% |
| 2019 | $13,439 -0.8% | $180,508 -0.6% |
| 2018 | $13,553 -3.5% | $181,585 -2.5% |
| 2017 | $14,051 -8.2% | $186,157 +3.6% |
| 2016 | $15,309 | $179,619 +1.1% |
| 2015 | -- | $177,682 +2.8% |
| 2014 | -- | $172,881 +1.3% |
| 2013 | -- | $170,587 +1.2% |
| 2012 | -- | $168,568 -7.8% |
| 2011 | -- | $182,810 -5.4% |
| 2010 | -- | $193,336 -8.8% |
| 2009 | -- | $212,100 +0.4% |
| 2008 | -- | $211,327 +0.8% |
| 2007 | -- | $209,713 +4.9% |
| 2006 | -- | $199,976 +0.5% |
| 2005 | -- | $198,916 +2.3% |
| 2004 | -- | $194,524 -7% |
| 2003 | -- | $209,068 +0.9% |
| 2002 | -- | $207,158 +9.8% |
| 2001 | -- | $188,597 +49.6% |
| 2000 | -- | $126,038 |
Source: MRED as distributed by MLS GRID. This data may not be complete. We recommend contacting the local school district to confirm school assignments for this home.