$403,300
2 bd|4 ba|1.8k sqft
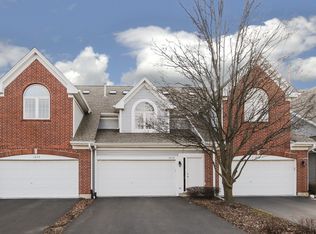
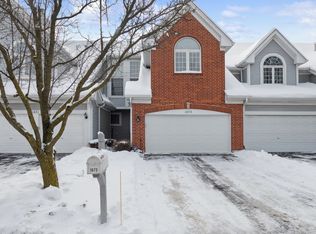
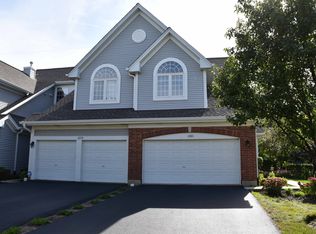
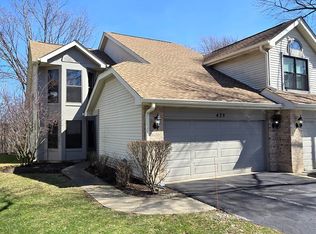
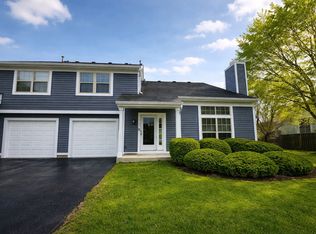
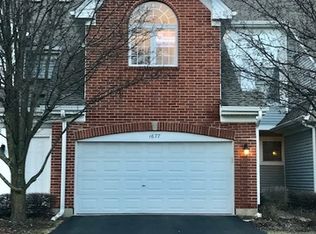
1677 W Ethans Glen Dr, Palatine, IL 60067
Off Market
Likely to sell faster than
Zillow last checked: 7 hours ago
Listing updated: April 03, 2026 at 09:02am
Abha Dey abha@abhadey.com,
iCalyx Real Estate
Not available
Estimated sales range
Not available
Not available
| Date | Event | Price |
|---|---|---|
| 4/2/2026 | Listed for sale | $375,000+42.9%$219/sqft |
Source: | ||
| 4/6/2018 | Sold | $262,500-2.7%$153/sqft |
Source: | ||
| 1/18/2018 | Pending sale | $269,900$158/sqft |
Source: Provident Realty Inc. #09809340 Report a problem | ||
| 1/7/2018 | Price change | $269,9000%$158/sqft |
Source: Provident Realty Inc. #09809340 Report a problem | ||
| 11/30/2017 | Listed for sale | $269,995+10.2%$158/sqft |
Source: Provident Realty Inc. #09809340 Report a problem | ||
| 10/18/2017 | Listing removed | $245,000$143/sqft |
Source: Provident Realty Inc. #09757197 Report a problem | ||
| 9/21/2017 | Price change | $245,000-5%$143/sqft |
Source: Provident Realty Inc. #09757197 Report a problem | ||
| 8/24/2017 | Price change | $257,900-0.8%$151/sqft |
Source: Provident Realty Inc. #09667178 Report a problem | ||
| 8/4/2017 | Price change | $259,999-1.1%$152/sqft |
Source: Provident Realty Inc. #09667178 Report a problem | ||
| 7/26/2017 | Price change | $262,900-0.8%$154/sqft |
Source: Provident Realty Inc. #09667178 Report a problem | ||
| 7/8/2017 | Price change | $264,900-1.9%$155/sqft |
Source: Provident Realty Inc. #09667178 Report a problem | ||
| 6/21/2017 | Price change | $269,900-5.3%$158/sqft |
Source: Provident Realty Inc. #09667178 Report a problem | ||
| 3/30/2017 | Price change | $284,900-1.7%$166/sqft |
Source: Provident Realty Inc. #09566262 Report a problem | ||
| 3/16/2017 | Listed for sale | $289,900+2.6%$169/sqft |
Source: Provident Realty Inc. #09566262 Report a problem | ||
| 6/8/2004 | Sold | $282,500+11.9%$165/sqft |
Source: Public Record Report a problem | ||
| 12/1/2003 | Sold | $252,500$147/sqft |
Source: Public Record Report a problem | ||
| Year | Property taxes | Tax assessment |
|---|---|---|
| 2023 | $8,585 +3.4% | $29,000 |
| 2022 | $8,306 +11.7% | $29,000 +26.7% |
| 2021 | $7,434 -2.1% | $22,891 -3.6% |
| 2020 | $7,594 +0.6% | $23,737 -9.8% |
| 2019 | $7,547 +29.9% | $26,317 +18.9% |
| 2018 | $5,811 +1.6% | $22,135 |
| 2017 | $5,720 +2.7% | $22,135 |
| 2016 | $5,568 -17.9% | $22,135 -10.4% |
| 2015 | $6,784 -9.5% | $24,704 |
| 2014 | $7,498 +2.6% | $24,704 |
| 2013 | $7,306 +4.7% | $24,704 -5.1% |
| 2012 | $6,976 +4.6% | $26,019 |
| 2011 | $6,670 +1.3% | $26,019 |
| 2010 | $6,582 -15.7% | $26,019 -23.2% |
| 2009 | $7,805 +5.4% | $33,881 -5% |
| 2008 | $7,409 +2% | $35,666 |
| 2007 | $7,260 +8.4% | $35,666 +16.6% |
| 2006 | $6,698 -1.1% | $30,578 |
| 2005 | $6,773 +3.7% | $30,578 |
| 2004 | $6,528 +23.8% | $30,578 +28.3% |
| 2003 | $5,271 +3.3% | $23,830 |
| 2002 | $5,103 | $23,830 +290.8% |
| 2001 | -- | $6,098 |
Source: MRED as distributed by MLS GRID. This data may not be complete. We recommend contacting the local school district to confirm school assignments for this home.