$223,900
2 bd|2 ba|1.3k sqft
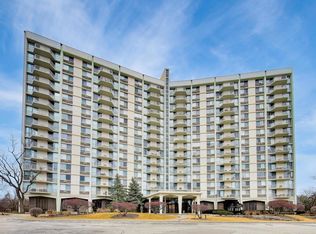
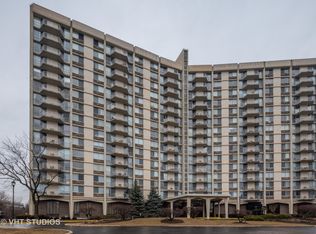
40 N Tower Rd SUITE 2-A, Oak Brook, IL 60523
Off Market
Zillow last checked: 8 hours ago
Listing updated: February 28, 2026 at 02:29pm
Andrea Routen 708-524-1100,
Coldwell Banker Realty
Not available
Estimated sales range
Not available
$2,528/mo
| Date | Event | Price |
|---|---|---|
| 2/28/2026 | Listed for sale | $269,000+45.4%$209/sqft |
Source: | ||
| 11/16/2018 | Sold | $185,000-2.1%$144/sqft |
Source: | ||
| 10/17/2018 | Pending sale | $189,000$147/sqft |
Source: Berg Properties #10051242 Report a problem | ||
| 10/5/2018 | Price change | $189,000-0.3%$147/sqft |
Source: Berg Properties #10051242 Report a problem | ||
| 9/21/2018 | Price change | $189,500-0.3%$147/sqft |
Source: Berg Properties #10051242 Report a problem | ||
| 8/31/2018 | Price change | $189,999-4.5%$148/sqft |
Source: Berg Properties #10051242 Report a problem | ||
| 8/28/2018 | Price change | $199,000-0.5%$155/sqft |
Source: Berg Properties #10051242 Report a problem | ||
| 8/14/2018 | Listed for sale | $199,900+74.3%$155/sqft |
Source: Berg Properties #10051242 Report a problem | ||
| 2/9/2018 | Listing removed | $114,690-0.5%$89/sqft |
Source: Auction.com Report a problem | ||
| 1/5/2018 | Listing removed | $115,278+4.8%$90/sqft |
Source: Auction.com Report a problem | ||
| 9/29/2017 | Listed for sale | -- |
Source: Auction.com Report a problem | ||
| 5/11/1994 | Sold | $110,000$86/sqft |
Source: Public Record Report a problem | ||
| Year | Property taxes | Tax assessment |
|---|---|---|
| 2024 | $4,727 +5.8% | $63,694 +8.1% |
| 2023 | $4,468 +16.7% | $58,900 +14.1% |
| 2022 | $3,828 +3.4% | $51,600 +2.6% |
| 2021 | $3,701 +2% | $50,310 +2.2% |
| 2020 | $3,628 -4.2% | $49,210 -4.5% |
| 2019 | $3,786 +11.7% | $51,510 +17.9% |
| 2018 | $3,390 +8.8% | $43,700 +10.2% |
| 2017 | $3,115 +0.2% | $39,650 +6.2% |
| 2016 | $3,110 +1.6% | $37,350 +7.4% |
| 2015 | $3,062 -3.1% | $34,790 -2.2% |
| 2014 | $3,159 +2% | $35,590 -1.4% |
| 2013 | $3,098 +3.2% | $36,090 -6.2% |
| 2012 | $3,001 -13.3% | $38,470 -24.5% |
| 2011 | $3,462 -4.4% | $50,940 -12% |
| 2010 | $3,620 +3.4% | $57,870 -6.8% |
| 2009 | $3,499 +2.7% | $62,090 |
| 2008 | $3,407 +6.9% | $62,090 +8.8% |
| 2007 | $3,186 -0.4% | $57,070 +1.4% |
| 2006 | $3,200 +5.3% | $56,280 +6.9% |
| 2005 | $3,039 +6.8% | $52,650 +6.3% |
| 2004 | $2,845 -2.2% | $49,530 -0.3% |
| 2003 | $2,909 +7.7% | $49,670 +10.3% |
| 2002 | $2,700 +3.1% | $45,030 +8.7% |
| 2001 | $2,620 +1.7% | $41,420 +5.2% |
| 2000 | $2,576 | $39,370 |
Source: MRED as distributed by MLS GRID. This data may not be complete. We recommend contacting the local school district to confirm school assignments for this home.