$416,900
3 bd|2 ba|1.3k sqft
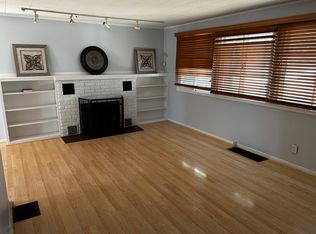
124 N Huffman St, Naperville, IL 60540
Off Market

Zillow last checked: 8 hours ago
Listing updated: February 24, 2026 at 10:06pm
Erik Sachs 773-368-5515,
@properties Christie's International Real Estate
Not available
Estimated sales range
Not available
Not available
| Date | Event | Price |
|---|---|---|
| 2/20/2026 | Listed for sale | $1,375,000-49.1%$448/sqft |
Source: | ||
| 1/29/2026 | Listing removed | $2,699,900$880/sqft |
Source: | ||
| 5/21/2025 | Listed for sale | $2,699,900+575%$880/sqft |
Source: | ||
| 12/11/2024 | Sold | $400,000-5.9%$130/sqft |
Source: | ||
| 11/20/2024 | Contingent | $424,900$138/sqft |
Source: | ||
| 11/11/2024 | Listed for sale | $424,900+239.9%$138/sqft |
Source: | ||
| 10/5/2024 | Listing removed | $3,200$1/sqft |
Source: Zillow Rentals Report a problem | ||
| 9/25/2024 | Price change | $3,200+6.7%$1/sqft |
Source: Zillow Rentals Report a problem | ||
| 9/23/2024 | Price change | $3,000-16.7%$1/sqft |
Source: Zillow Rentals Report a problem | ||
| 9/20/2024 | Listed for rent | $3,600+28.6%$1/sqft |
Source: Zillow Rentals Report a problem | ||
| 6/15/2023 | Listing removed | -- |
Source: Zillow Rentals Report a problem | ||
| 5/30/2023 | Price change | $2,800-6.7%$1/sqft |
Source: Zillow Rentals Report a problem | ||
| 4/28/2023 | Listed for rent | $3,000+15.4%$1/sqft |
Source: Zillow Rentals Report a problem | ||
| 6/9/2022 | Listing removed | -- |
Source: Zillow Rental Manager Report a problem | ||
| 5/31/2022 | Listed for rent | $2,600$1/sqft |
Source: Zillow Rental Manager Report a problem | ||
| 12/16/2011 | Sold | $125,000-49.4%$41/sqft |
Source: | ||
| 11/7/2006 | Sold | $247,000+14.4%$80/sqft |
Source: Public Record Report a problem | ||
| 8/25/2003 | Sold | $216,000$70/sqft |
Source: Public Record Report a problem | ||
| Year | Property taxes | Tax assessment |
|---|---|---|
| 2024 | $5,888 +3.3% | $96,115 +9.6% |
| 2023 | $5,700 +5.4% | $87,720 +5% |
| 2022 | $5,407 +3.6% | $83,550 +3.9% |
| 2021 | $5,218 +2.1% | $80,390 +1.8% |
| 2020 | $5,111 +2.8% | $78,950 +4.5% |
| 2019 | $4,972 +3.5% | $75,540 +3.5% |
| 2018 | $4,806 +1.9% | $72,990 +3.5% |
| 2017 | $4,716 +1.9% | $70,520 +3.8% |
| 2016 | $4,630 +0.3% | $67,970 +6.2% |
| 2015 | $4,614 -3.1% | $64,010 |
| 2014 | $4,764 +1.5% | $64,010 -0.2% |
| 2013 | $4,693 +3.5% | $64,170 -3.7% |
| 2012 | $4,536 -33.6% | $66,660 -38.7% |
| 2011 | $6,828 -1.2% | $108,680 -7.3% |
| 2010 | $6,909 +1.4% | $117,180 -5% |
| 2009 | $6,810 +3.1% | $123,330 +1.4% |
| 2008 | $6,606 +5% | $121,620 +5.9% |
| 2007 | $6,290 +20.6% | $114,840 +17.6% |
| 2006 | $5,215 +3.7% | $97,630 +6.7% |
| 2005 | $5,030 +9.7% | $91,500 +12.8% |
| 2004 | $4,586 +5.3% | $81,090 +8.4% |
| 2003 | $4,357 +14% | $74,800 +14.2% |
| 2002 | $3,823 +11.4% | $65,500 +7.5% |
| 2001 | $3,431 +53.8% | $60,940 +5.9% |
| 2000 | $2,230 | $57,540 |
Source: MRED as distributed by MLS GRID. This data may not be complete. We recommend contacting the local school district to confirm school assignments for this home.