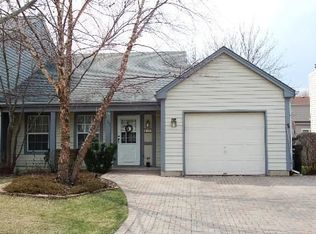
$307,500
3 bd|2 ba|1.5k sqft
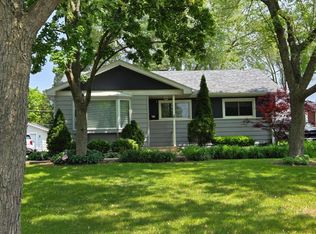
1201 Ashbrook Dr, Mundelein, IL 60060
Off Market
Likely to sell faster than
Zillow last checked: 7 hours ago
Listing updated: March 17, 2026 at 08:39am
Sonny Ruan 312-731-8015,
Chi Real Estate Group LLC,
Calvin Zhao 312-856-3350,
Chi Real Estate Group LLC
Not available
Estimated sales range
Not available
Not available
| Date | Event | Price |
|---|---|---|
| 3/17/2026 | Listed for sale | $338,000+64.9%$182/sqft |
Source: | ||
| 8/19/2018 | Listing removed | $205,000$110/sqft |
Source: HomeSmart Connect #09987598 Report a problem | ||
| 7/14/2018 | Price change | $205,000-2.3%$110/sqft |
Source: Homesmart Connect LLC #09987598 Report a problem | ||
| 6/16/2018 | Price change | $209,900-2.4%$113/sqft |
Source: Homesmart Connect LLC #09987598 Report a problem | ||
| 5/16/2018 | Listed for sale | $215,000+9.7%$116/sqft |
Source: Keller Williams Infinity #09952406 Report a problem | ||
| 10/2/2003 | Sold | $196,000+6.5%$105/sqft |
Source: Public Record Report a problem | ||
| 9/10/2002 | Sold | $184,000+14.3%$99/sqft |
Source: Public Record Report a problem | ||
| 6/29/2001 | Sold | $161,000+12.6%$87/sqft |
Source: Public Record Report a problem | ||
| 4/30/1999 | Sold | $143,000+68.2%$77/sqft |
Source: Public Record Report a problem | ||
| 3/23/1994 | Sold | $85,000$46/sqft |
Source: Public Record Report a problem | ||
| Year | Property taxes | Tax assessment |
|---|---|---|
| 2023 | $8,320 +9.9% | $94,230 +9.1% |
| 2022 | $7,570 +10.7% | $86,339 +13.1% |
| 2021 | $6,840 +1.7% | $76,364 +12.2% |
| 2020 | $6,724 +3.4% | $68,064 +3.4% |
| 2019 | $6,505 +5.2% | $65,826 +3.5% |
| 2018 | $6,182 | $63,614 +3.3% |
| 2017 | $6,182 +5.7% | $61,611 +5.3% |
| 2016 | $5,849 +9.8% | $58,516 +6.7% |
| 2015 | $5,326 +4% | $54,857 +10.7% |
| 2014 | $5,123 +6.7% | $49,556 -0.9% |
| 2012 | $4,802 +0.6% | $49,995 -24.2% |
| 2011 | $4,775 -17.4% | $65,992 -7.7% |
| 2010 | $5,782 +4.5% | $71,480 -4.5% |
| 2009 | $5,532 +0.2% | $74,852 -0.8% |
| 2008 | $5,522 +6.1% | $75,487 -0.2% |
| 2006 | $5,203 -1.8% | $75,616 |
| 2005 | $5,296 -0.3% | -- |
| 2004 | $5,312 +4.9% | -- |
| 2003 | $5,062 +9.7% | -- |
| 2002 | $4,616 +12.4% | -- |
| 2001 | $4,107 +4.4% | $51,844 +4% |
| 2000 | $3,933 | $49,865 |
Source: MRED as distributed by MLS GRID. This data may not be complete. We recommend contacting the local school district to confirm school assignments for this home.