$12,643
-- bd|-- ba|-- sqft
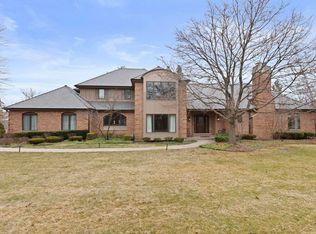
14 Alexandra Dr, Mettawa, IL 60048
Off Market
Zillow last checked: 7 hours ago
Listing updated: November 23, 2025 at 10:07pm
Jeff Ohm 847-490-7400,
Premier Realty Group, Inc.,
Tom Glusic, CRS,GRI 847-456-7292,
Coldwell Banker Realty
$1,940,500
$1.84M - $2.04M
$6,895/mo
| Date | Event | Price |
|---|---|---|
| 11/18/2025 | Listed for sale | $1,999,900+365.1%$457/sqft |
Source: | ||
| 5/19/2017 | Listing removed | $430,000$98/sqft |
Source: Baird & Warner #09361722 Report a problem | ||
| 10/7/2016 | Listed for sale | $430,000+115%$98/sqft |
Source: Baird & Warner #09361722 Report a problem | ||
| 11/15/2011 | Sold | $200,000+33.3%$46/sqft |
Source: Agent Provided Report a problem | ||
| 6/2/2011 | Sold | $150,000-11.8%$34/sqft |
Source: Agent Provided Report a problem | ||
| 3/2/2011 | Listing removed | $170,000$39/sqft |
Source: Re/Max Professionals #07700603 Report a problem | ||
| 2/26/2011 | Listed for sale | $170,000$39/sqft |
Source: Re/Max Professionals #07700603 Report a problem | ||
| 1/16/2011 | Pending sale | $170,000$39/sqft |
Source: Re/Max Professionals #07700603 Report a problem | ||
| 1/2/2011 | Listed for sale | $170,000$39/sqft |
Source: Re/Max Professionals #07700603 Report a problem | ||
| 10/8/2010 | Listing removed | $170,000$39/sqft |
Source: Re/Max Professionals #07512464 Report a problem | ||
| 6/12/2010 | Price change | $170,000-43.2%$39/sqft |
Source: Re/Max Professionals #07512464 Report a problem | ||
| 4/29/2010 | Listed for sale | $299,250$68/sqft |
Source: Re/Max Professionals #07512464 Report a problem | ||
| Year | Property taxes | Tax assessment |
|---|---|---|
| 2023 | $12,430 -19.8% | $141,769 +6% |
| 2022 | $15,504 +2.9% | $133,770 -20% |
| 2021 | $15,062 +1.7% | $167,250 +0.7% |
| 2020 | $14,811 +2.1% | $166,011 +0.4% |
| 2019 | $14,512 +5.8% | $165,399 +3.8% |
| 2018 | $13,715 | $159,329 +2.4% |
| 2017 | $13,715 +4.2% | $155,610 +4.4% |
| 2016 | $13,159 -7.8% | $149,009 +6.9% |
| 2015 | $14,268 -0.7% | $139,352 -6.9% |
| 2014 | $14,373 +5.7% | $149,664 -0.2% |
| 2012 | $13,599 +0.8% | $149,964 -3.5% |
| 2011 | $13,497 -37.3% | $155,386 -41.7% |
| 2010 | $21,521 +2.9% | $266,697 -5.2% |
| 2009 | $20,911 +3.4% | $281,474 +2% |
| 2008 | $20,215 +1233.2% | $275,822 +1117.4% |
| 2006 | $1,516 -0.4% | $22,656 |
| 2005 | $1,522 -90.2% | -- |
| 2004 | $15,527 | -- |
Source: MRED as distributed by MLS GRID. This data may not be complete. We recommend contacting the local school district to confirm school assignments for this home.