$2,051,900
6 bd|6 ba|1 sqft
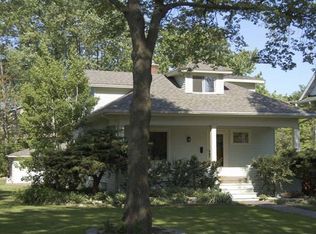
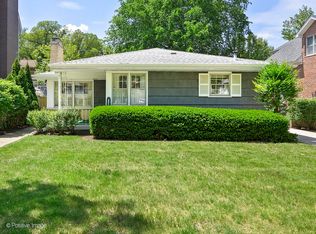
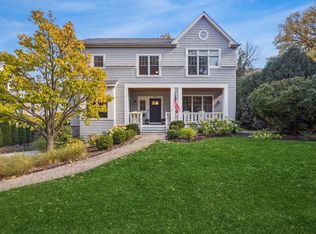
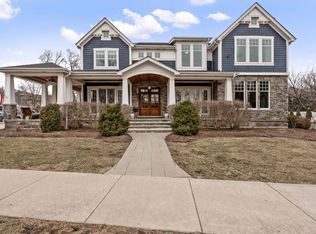
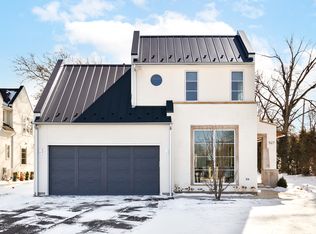
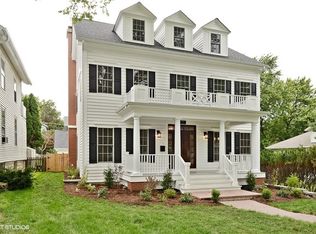
224 S Adams St, Hinsdale, IL 60521
Off Market
Zillow last checked: 8 hours ago
Listing updated: March 04, 2026 at 11:59am
Lauren Walz 708-846-5676,
Coldwell Banker Realty,
Dawn McKenna 630-686-4886,
Coldwell Banker Realty
Not available
Estimated sales range
Not available
Not available
| Date | Event | Price |
|---|---|---|
| 3/4/2026 | Listed for sale | $2,199,000+4.7%$520/sqft |
Source: | ||
| 6/26/2025 | Sold | $2,100,000+0%$496/sqft |
Source: | ||
| 5/22/2025 | Contingent | $2,099,000$496/sqft |
Source: | ||
| 5/7/2025 | Listed for sale | $2,099,000$496/sqft |
Source: | ||
| 5/7/2025 | Listing removed | $2,099,000$496/sqft |
Source: | ||
| 4/29/2025 | Contingent | $2,099,000$496/sqft |
Source: | ||
| 4/11/2025 | Listed for sale | $2,099,000+405.8%$496/sqft |
Source: | ||
| 1/22/2024 | Sold | $415,000-9.6%$98/sqft |
Source: | ||
| 1/17/2024 | Pending sale | $459,000$109/sqft |
Source: | ||
| 1/9/2024 | Contingent | $459,000$109/sqft |
Source: | ||
| 11/21/2023 | Price change | $459,000-6.1%$109/sqft |
Source: | ||
| 10/2/2023 | Listed for sale | $489,000+36.6%$116/sqft |
Source: | ||
| 12/10/2021 | Sold | $358,000+11.9%$85/sqft |
Source: Public Record Report a problem | ||
| 12/1/2021 | Pending sale | $319,900$76/sqft |
Source: | ||
| 11/13/2021 | Contingent | $319,900$76/sqft |
Source: | ||
| 11/7/2021 | Listed for sale | $319,900$76/sqft |
Source: | ||
| Year | Property taxes | Tax assessment |
|---|---|---|
| 2024 | $6,123 -31.5% | $118,113 -32.3% |
| 2023 | $8,934 +0.3% | $174,340 -0.9% |
| 2022 | $8,909 +7% | $175,930 +1.1% |
| 2021 | $8,328 +2.4% | $173,930 +2% |
| 2020 | $8,130 +0.2% | $170,480 |
| 2019 | $8,117 +14.3% | -- |
| 2018 | $7,103 +4% | $149,400 +3.9% |
| 2017 | $6,829 +14.9% | $143,760 +16.6% |
| 2016 | $5,941 -3.6% | $123,290 +6.3% |
| 2015 | $6,165 +7.8% | $115,990 +11% |
| 2014 | $5,721 +2% | $104,480 +0.5% |
| 2013 | $5,608 +0.1% | $103,990 -4.3% |
| 2012 | $5,604 +4.7% | $108,670 -6.1% |
| 2011 | $5,353 -23.6% | $115,730 -29.9% |
| 2010 | $7,011 +4.5% | $165,010 -5.8% |
| 2009 | $6,712 +3% | $175,150 |
| 2008 | $6,517 +3.4% | $175,150 +5.9% |
| 2007 | $6,300 +19.7% | $165,390 +23.5% |
| 2006 | $5,262 +4.8% | $133,930 +7.7% |
| 2005 | $5,024 -2.5% | $124,360 +7% |
| 2004 | $5,151 +9.7% | $116,220 +10% |
| 2003 | $4,695 +23.2% | $105,660 +29.1% |
| 2002 | $3,811 +11.1% | $81,820 +6.8% |
| 2001 | $3,430 +12% | $76,630 +13.7% |
| 2000 | $3,061 | $67,380 |
Source: MRED as distributed by MLS GRID. This data may not be complete. We recommend contacting the local school district to confirm school assignments for this home.