$226,200
-- bd|-- ba|-- sqft
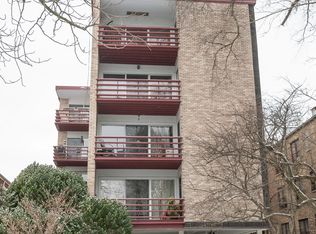
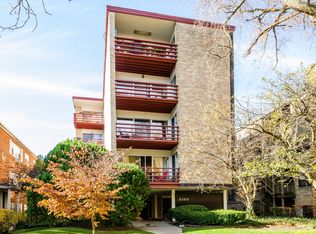
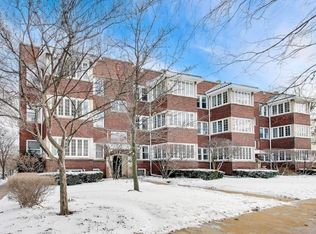
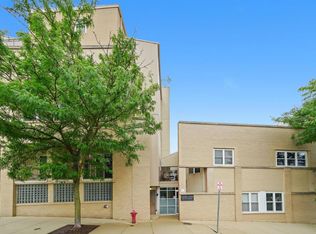
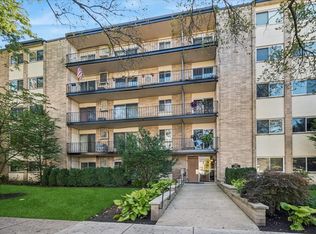
2150 Sherman Ave APT 1A, Evanston, IL 60201
Off Market
Likely to sell faster than
Zillow last checked: 8 hours ago
Listing updated: February 23, 2026 at 10:07pm
Meredith Schreiber 847-763-0200,
@properties Christie's International Real Estate
Not available
Estimated sales range
Not available
Not available
| Date | Event | Price |
|---|---|---|
| 2/18/2026 | Listed for sale | $285,000+56.2%$259/sqft |
Source: | ||
| 4/29/2011 | Sold | $182,500-8.3%$166/sqft |
Source: | ||
| 3/17/2011 | Price change | $199,000-9.1%$181/sqft |
Source: Coldwell Banker Residential Brokerage - Evanston #07607862 Report a problem | ||
| 11/13/2010 | Price change | $219,000-4.4%$199/sqft |
Source: NRT Chicago #07607862 Report a problem | ||
| 8/15/2010 | Listed for sale | $229,000-4.4%$208/sqft |
Source: NRT Chicago #07607862 Report a problem | ||
| 2/7/2009 | Listing removed | $239,500$218/sqft |
Source: NRT Chicago #06803001 Report a problem | ||
| 12/21/2008 | Price change | $239,500-7.5%$218/sqft |
Source: NRT Chicago #06803001 Report a problem | ||
| 8/19/2008 | Price change | $259,000-3.9%$235/sqft |
Source: NRT Chicago #06803001 Report a problem | ||
| 6/19/2008 | Listed for sale | $269,500-6.7%$245/sqft |
Source: NRT Chicago #06803001 Report a problem | ||
| 4/25/2008 | Listing removed | $289,000$263/sqft |
Source: Postlets #06803001 Report a problem | ||
| 2/26/2008 | Listed for sale | $289,000$263/sqft |
Source: Postlets #06803001 Report a problem | ||
| 7/19/2006 | Sold | $289,000+13.8%$263/sqft |
Source: Public Record Report a problem | ||
| 8/4/2004 | Sold | $254,000+50.7%$231/sqft |
Source: Public Record Report a problem | ||
| 6/14/2001 | Sold | $168,500$153/sqft |
Source: Public Record Report a problem | ||
| Year | Property taxes | Tax assessment |
|---|---|---|
| 2023 | $2,698 +1% | $18,492 |
| 2022 | $2,671 -4.4% | $18,492 +7.6% |
| 2021 | $2,794 -2.9% | $17,190 |
| 2020 | $2,876 +2.8% | $17,190 -8.6% |
| 2019 | $2,798 -19.6% | $18,799 -4% |
| 2018 | $3,481 -19.5% | $19,576 |
| 2017 | $4,323 +0% | $19,576 |
| 2016 | $4,322 +21.8% | $19,576 +23.5% |
| 2015 | $3,548 +0.5% | $15,854 |
| 2014 | $3,528 +2.8% | $15,854 |
| 2013 | $3,431 -19.9% | $15,854 -23.2% |
| 2012 | $4,286 +2.1% | $20,632 |
| 2011 | $4,198 -0.6% | $20,632 |
| 2010 | $4,222 +16.2% | $20,632 -9.6% |
| 2009 | $3,635 -5.3% | $22,824 -20.2% |
| 2008 | $3,838 +13.4% | $28,600 |
| 2007 | $3,385 -12.2% | $28,600 +55.7% |
| 2006 | $3,856 +52.1% | $18,374 |
| 2005 | $2,535 -31.4% | $18,374 |
| 2004 | $3,696 +40.7% | $18,374 +33.6% |
| 2003 | $2,627 -10.8% | $13,748 |
| 2002 | $2,946 -9.5% | $13,748 |
| 2001 | $3,255 +32.4% | $13,748 +2% |
| 2000 | $2,458 +3.2% | $13,481 |
| 1999 | $2,382 | $13,481 |
Source: MRED as distributed by MLS GRID. This data may not be complete. We recommend contacting the local school district to confirm school assignments for this home.