$321,200
3 bd|3 ba|1.5k sqft
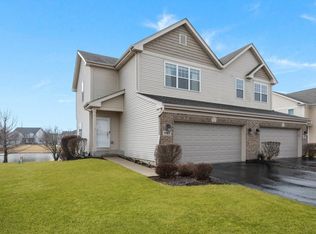
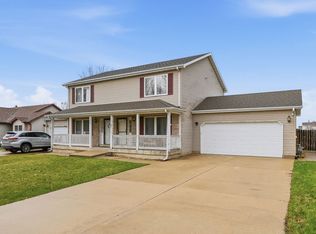
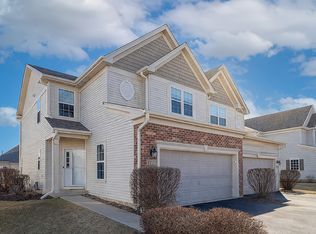
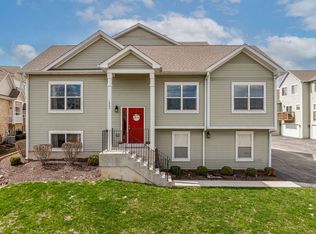
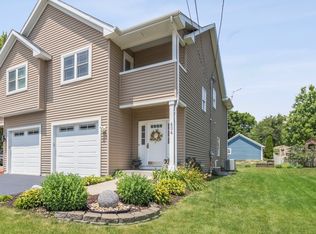
434 W Pierce St, Elburn, IL 60119
Off Market
Zillow last checked: 7 hours ago
Listing updated: 16 hours ago
Anne Kothe 630-935-4739,
Keller Williams Inspire
Not available
Estimated sales range
Not available
Not available
| Date | Event | Price |
|---|---|---|
| 4/9/2026 | Listed for sale | $289,000+23%$187/sqft |
Source: | ||
| 3/3/2023 | Sold | $235,000+0%$152/sqft |
Source: | ||
| 2/11/2023 | Contingent | $234,900$152/sqft |
Source: | ||
| 2/8/2023 | Listed for sale | $234,900+27.7%$152/sqft |
Source: | ||
| 9/4/2019 | Sold | $184,000-3.1%$119/sqft |
Source: | ||
| 9/4/2019 | Listed for sale | $189,900$123/sqft |
Source: REMAX All Pro - St Charles #10446087 Report a problem | ||
| 8/7/2019 | Pending sale | $189,900$123/sqft |
Source: REMAX All Pro - St Charles #10446087 Report a problem | ||
| 8/6/2019 | Price change | $189,900-5%$123/sqft |
Source: REMAX All Pro - St Charles #10446087 Report a problem | ||
| 7/26/2019 | Listed for sale | $199,900$129/sqft |
Source: REMAX All Pro - St Charles #10446087 Report a problem | ||
| 7/14/2019 | Pending sale | $199,900$129/sqft |
Source: REMAX All Pro - St Charles #10446087 Report a problem | ||
| 7/10/2019 | Listed for sale | $199,900$129/sqft |
Source: REMAX All Pro - St Charles #10446087 Report a problem | ||
| 12/2/2013 | Listing removed | $1,595$1/sqft |
Source: Zillow Rental Network Report a problem | ||
| 11/2/2013 | Price change | $1,595-5.9%$1/sqft |
Source: Postlets Report a problem | ||
| 10/28/2013 | Price change | $1,695+16.9%$1/sqft |
Source: Postlets Report a problem | ||
| 11/28/2012 | Listed for rent | $1,450$1/sqft |
Source: Owner Report a problem | ||
| Year | Property taxes | Tax assessment |
|---|---|---|
| 2024 | $5,927 -2.3% | $78,314 +4.6% |
| 2023 | $6,070 +4.9% | $74,898 +10.4% |
| 2022 | $5,788 +3.5% | $67,833 +4.5% |
| 2021 | $5,591 +1.8% | $64,924 +2.4% |
| 2020 | $5,490 0% | $63,402 +1.5% |
| 2019 | $5,490 +3.3% | $62,471 +4.9% |
| 2018 | $5,314 +0% | $59,538 +1.2% |
| 2017 | $5,312 -9.2% | $58,861 +4.2% |
| 2016 | $5,850 | $56,510 +42.2% |
| 2015 | -- | $39,726 0% |
| 2014 | -- | $39,730 |
| 2013 | -- | $39,730 -10.7% |
| 2012 | -- | $44,486 -24.3% |
| 2011 | -- | $58,771 -10.9% |
| 2010 | -- | $65,982 |
| 2009 | -- | $65,982 +47.7% |
| 2008 | -- | $44,672 |
Source: MRED as distributed by MLS GRID. This data may not be complete. We recommend contacting the local school district to confirm school assignments for this home.