$157,000
-- bd|1 ba|800 sqft
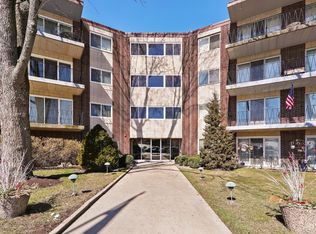
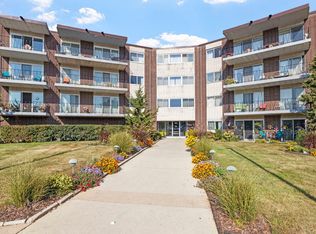
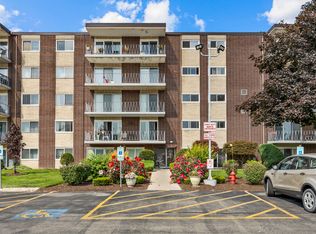
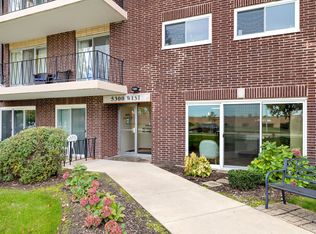
5540 Walnut Ave APT 1A, Downers Grove, IL 60515
Off Market
Zillow last checked: 7 hours ago
Listing updated: February 08, 2026 at 10:07pm
Lina Zakarauskas 708-336-1381,
Coldwell Banker Realty
Not available
Estimated sales range
Not available
Not available
| Date | Event | Price |
|---|---|---|
| 2/3/2026 | Price change | $189,500-2.8%$237/sqft |
Source: | ||
| 11/20/2025 | Price change | $195,000-2.5%$244/sqft |
Source: | ||
| 11/6/2025 | Listed for sale | $199,999+127.3%$250/sqft |
Source: | ||
| 5/26/2017 | Sold | $88,000-5.4%$110/sqft |
Source: | ||
| 4/9/2017 | Pending sale | $93,000$116/sqft |
Source: Coldwell Banker Residential Brokerage - Downers Grove #09571482 Report a problem | ||
| 4/4/2017 | Price change | $93,000-2.1%$116/sqft |
Source: Coldwell Banker Residential Brokerage - Downers Grove #09571482 Report a problem | ||
| 3/22/2017 | Listed for sale | $95,000+31%$119/sqft |
Source: Coldwell Banker Residential #09571482 Report a problem | ||
| 1/27/2017 | Sold | $72,500-42.4%$91/sqft |
Source: Public Record Report a problem | ||
| 2/26/2009 | Sold | $125,900$157/sqft |
Source: | ||
| Year | Property taxes | Tax assessment |
|---|---|---|
| 2024 | $1,724 +102.1% | $42,557 +9.6% |
| 2023 | $853 -46.2% | $38,840 +30.8% |
| 2022 | $1,585 +5% | $29,690 +4% |
| 2021 | $1,509 +5% | $28,560 +1.8% |
| 2020 | $1,438 +2.8% | $28,050 +4.5% |
| 2019 | $1,398 +37.8% | $26,840 +26.3% |
| 2018 | $1,014 +11.4% | $21,250 +10% |
| 2017 | $910 +73.3% | $19,310 +3.8% |
| 2016 | $525 +10.4% | $18,610 +6.2% |
| 2015 | $476 -1% | $17,530 |
| 2014 | $481 -15.8% | $17,530 -7.2% |
| 2013 | $571 -37.1% | $18,900 -19.9% |
| 2012 | $908 -28.3% | $23,610 -22.2% |
| 2011 | $1,267 -15.8% | $30,350 -15.4% |
| 2010 | $1,505 -10.9% | $35,870 -5% |
| 2009 | $1,689 +17.1% | $37,750 +1.4% |
| 2008 | $1,443 +2.2% | $37,230 +5.9% |
| 2007 | $1,412 -4.2% | $35,150 +7% |
| 2006 | $1,474 +19% | $32,850 +6.7% |
| 2005 | $1,238 +6.5% | $30,780 +5.9% |
| 2004 | $1,163 -2.5% | $29,060 +8.4% |
| 2003 | $1,193 +18.1% | $26,810 +7.5% |
| 2002 | $1,010 +6.3% | $24,940 +7.5% |
| 2001 | $950 +6% | $23,200 +5.9% |
| 2000 | $897 | $21,910 |
Source: MRED as distributed by MLS GRID. This data may not be complete. We recommend contacting the local school district to confirm school assignments for this home.