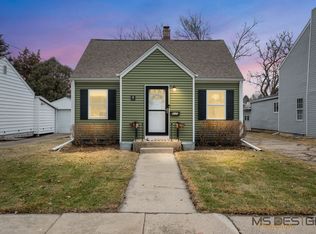
$191,000
3 bd|1 ba|850 sqft
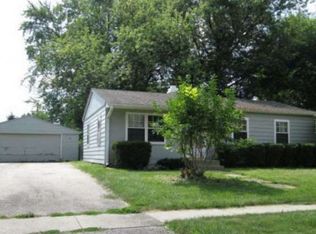
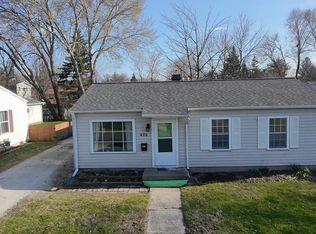
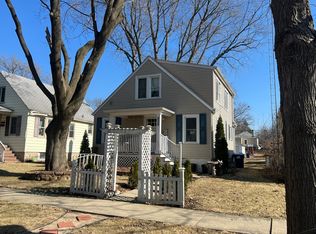
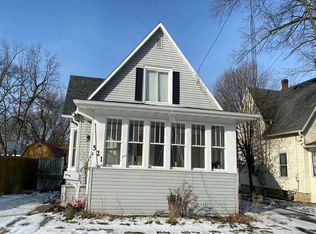
426 Spring Ave, Dekalb, IL 60115
Off Market
Zillow last checked: 8 hours ago
Listing updated: February 20, 2026 at 01:06am
Abraham Antar 630-270-8080,
Antar Realty LLC
Not available
Estimated sales range
Not available
Not available
| Date | Event | Price |
|---|---|---|
| 2/20/2026 | Price change | $249,000+8.7%$262/sqft |
Source: | ||
| 2/5/2026 | Price change | $229,000-4.2%$241/sqft |
Source: | ||
| 1/14/2026 | Listed for sale | $239,000+16.6%$252/sqft |
Source: | ||
| 10/1/2025 | Listing removed | $205,000$216/sqft |
Source: | ||
| 8/13/2025 | Price change | $205,000-6.4%$216/sqft |
Source: | ||
| 7/2/2025 | Price change | $219,000-2.7%$231/sqft |
Source: | ||
| 5/21/2025 | Listed for sale | $225,000+52%$237/sqft |
Source: | ||
| 5/2/2025 | Sold | $148,000+26.5%$156/sqft |
Source: Public Record Report a problem | ||
| 11/4/2021 | Sold | $117,000$123/sqft |
Source: Public Record Report a problem | ||
| 8/17/2021 | Sold | $117,000+29.3%$123/sqft |
Source: Agent Provided Report a problem | ||
| 3/24/2021 | Listing removed | -- |
Source: Owner Report a problem | ||
| 9/7/2017 | Listing removed | $1,200$1/sqft |
Source: Owner Report a problem | ||
| 7/21/2017 | Listed for rent | $1,200$1/sqft |
Source: Owner Report a problem | ||
| 7/17/2017 | Sold | $90,500-9.3%$95/sqft |
Source: | ||
| 6/3/2017 | Pending sale | $99,800$105/sqft |
Source: Schulenburg Realty Inc #09615380 Report a problem | ||
| 5/13/2017 | Price change | $99,800-0.2%$105/sqft |
Source: Schulenburg Realty Inc #09615380 Report a problem | ||
| 5/4/2017 | Listed for sale | $100,000-15.2%$105/sqft |
Source: Schulenburg Realty Inc #09615380 Report a problem | ||
| 1/30/2011 | Listing removed | $117,900$124/sqft |
Source: RE/MAX #07432917 Report a problem | ||
| 11/21/2010 | Price change | $117,900-0.1%$124/sqft |
Source: RE/MAX #07432917 Report a problem | ||
| 10/18/2010 | Listed for sale | $118,000$124/sqft |
Source: RE/MAX #07432917 Report a problem | ||
| Year | Property taxes | Tax assessment |
|---|---|---|
| 2024 | $3,754 -2.9% | $47,126 +14.7% |
| 2023 | $3,868 +2% | $41,090 +9.5% |
| 2022 | $3,791 -2.6% | $37,515 +6.6% |
| 2021 | $3,894 -2.2% | $35,186 +1.6% |
| 2020 | $3,982 +2% | $34,625 +4.1% |
| 2019 | $3,904 +2.4% | $33,265 +3.5% |
| 2018 | $3,812 +22.9% | $32,137 +4% |
| 2017 | $3,100 +1.8% | $30,892 +2.6% |
| 2016 | $3,047 -0.2% | $30,113 +5.5% |
| 2015 | $3,053 | $28,532 -2.2% |
| 2014 | $3,053 | $29,164 -4.8% |
| 2013 | $3,053 | $30,634 -8.9% |
| 2012 | -- | $33,638 -9% |
| 2011 | -- | $36,953 -5.1% |
| 2010 | -- | $38,935 -6.1% |
| 2009 | -- | $41,456 +1.5% |
| 2008 | -- | $40,843 +3.1% |
| 2007 | -- | $39,607 +25.3% |
| 2006 | -- | $31,616 |
Source: MRED as distributed by MLS GRID. This data may not be complete. We recommend contacting the local school district to confirm school assignments for this home.