$580,000
4 bd|3 ba|3.1k sqft
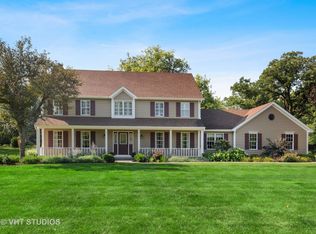
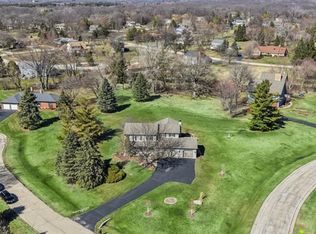
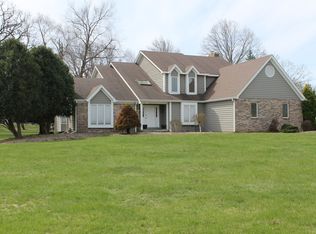
671 Old Westbury Rd, Crystal Lake, IL 60012
Sold
Zillow last checked: 7 hours ago
Listing updated: 15 hours ago
Tyler Lewke 815-307-2316,
Keller Williams Success Realty,
Tessie Smith-Meseth 918-440-5298,
Keller Williams Success Realty
Not available
Estimated sales range
Not available
Not available
| Date | Event | Price |
|---|---|---|
| 3/27/2026 | Listed for sale | $600,000+37.9%$186/sqft |
Source: | ||
| 7/12/2021 | Listing removed | -- |
Source: | ||
| 6/29/2021 | Contingent | $435,000$135/sqft |
Source: | ||
| 5/28/2021 | Price change | $435,000-3.3%$135/sqft |
Source: | ||
| 5/6/2021 | Listed for sale | $449,900$140/sqft |
Source: | ||
| 4/17/2021 | Contingent | $449,900$140/sqft |
Source: | ||
| 4/5/2021 | Listed for sale | $449,900+4.9%$140/sqft |
Source: | ||
| 8/7/2019 | Listing removed | $429,000$133/sqft |
Source: Keller Williams Success Realty #10441310 Report a problem | ||
| 7/6/2019 | Listed for sale | $429,000+15.9%$133/sqft |
Source: Keller Williams Success Realty #10441310 Report a problem | ||
| 5/30/2014 | Sold | $370,000+3.4%$115/sqft |
Source: | ||
| 4/26/2014 | Pending sale | $358,000$111/sqft |
Source: Coldwell Banker Residential Brokerage - Barrington #08583328 Report a problem | ||
| 3/29/2014 | Listed for sale | $358,000-25.4%$111/sqft |
Source: Owner Report a problem | ||
| 3/24/2008 | Listing removed | $479,900$149/sqft |
Source: Owner Report a problem | ||
| 2/16/2008 | Price change | $479,900-4%$149/sqft |
Source: Owner Report a problem | ||
| 2/4/2008 | Price change | $500,000-4.8%$155/sqft |
Source: Owner Report a problem | ||
| 2/3/2008 | Listed for sale | $525,000+58.4%$163/sqft |
Source: Owner Report a problem | ||
| 3/23/1998 | Sold | $331,500+4.2%$103/sqft |
Source: Public Record Report a problem | ||
| 9/18/1996 | Sold | $318,000$99/sqft |
Source: Public Record Report a problem | ||
| Year | Property taxes | Tax assessment |
|---|---|---|
| 2024 | $13,563 +3% | $166,311 +11.5% |
| 2023 | $13,163 -11.4% | $149,145 -7.2% |
| 2022 | $14,858 +4.8% | $160,723 +6.7% |
| 2021 | $14,181 +1.8% | $150,687 +3.1% |
| 2020 | $13,924 | $146,170 +5.2% |
| 2019 | -- | $138,971 +1.3% |
| 2018 | $13,574 -1.3% | $137,194 +4.4% |
| 2017 | $13,749 +0.7% | $131,437 +4.8% |
| 2016 | $13,651 | $125,405 -6.5% |
| 2013 | $13,651 | $134,145 -11.5% |
| 2011 | -- | $151,510 -7.2% |
| 2010 | -- | $163,230 -6.1% |
| 2009 | -- | $173,815 |
| 2008 | -- | $173,815 +7.7% |
| 2006 | -- | $161,356 +4.7% |
| 2005 | $11,072 +8.2% | $154,098 +6.3% |
| 2004 | $10,228 +4.2% | $144,938 +6.1% |
| 2003 | $9,819 +5.5% | $136,541 +6.4% |
| 2002 | $9,307 +1.7% | $128,268 +3.9% |
| 2001 | $9,153 +5.1% | $123,418 +9.8% |
| 2000 | $8,708 | $112,367 |
Source: MRED as distributed by MLS GRID. This data may not be complete. We recommend contacting the local school district to confirm school assignments for this home.