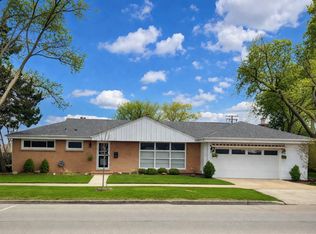
$643,700
4 bd|3 ba|1.5k sqft
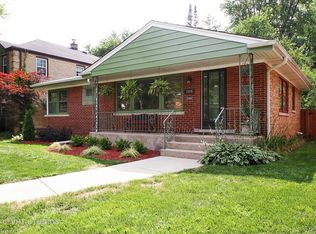
7076 N Mason Ave, Chicago, IL 60646
Off Market
Zillow last checked: 7 hours ago
Listing updated: 14 hours ago
Dennis Huyck 312-420-1593,
Keller Williams ONEChicago
Not available
Estimated sales range
Not available
Not available
| Date | Event | Price |
|---|---|---|
| 4/6/2026 | Listed for sale | $650,000+91.8%$232/sqft |
Source: | ||
| 5/31/2013 | Sold | $338,900-10.6%$121/sqft |
Source: | ||
| 4/2/2013 | Price change | $379,000-4.1%$135/sqft |
Source: @properties #08261719 Report a problem | ||
| 2/2/2013 | Listed for sale | $395,000-1.2%$141/sqft |
Source: @properties #08261719 Report a problem | ||
| 10/14/2012 | Listing removed | $399,900$143/sqft |
Source: Coldwell Banker Residential Brokerage - Lake View #08029990 Report a problem | ||
| 8/23/2012 | Price change | $399,900-3.6%$143/sqft |
Source: Coldwell Banker Residential Brokerage - Lake View #08029990 Report a problem | ||
| 7/28/2012 | Price change | $415,000-3.5%$148/sqft |
Source: Coldwell Banker Residential Brokerage - Lake View #08029990 Report a problem | ||
| 6/6/2012 | Price change | $429,900-4.4%$154/sqft |
Source: Coldwell Banker Residential Brokerage - Lake View #08029990 Report a problem | ||
| 5/2/2012 | Price change | $449,900-4.1%$161/sqft |
Source: Coldwell Banker Residential Brokerage - Lake View #08029990 Report a problem | ||
| 4/1/2012 | Listed for sale | $469,000$168/sqft |
Source: Coldwell Banker Residential Brokerage - Lake View #08029990 Report a problem | ||
| Year | Property taxes | Tax assessment |
|---|---|---|
| 2023 | $9,850 +2.8% | $50,000 |
| 2022 | $9,581 +2.1% | $50,000 |
| 2021 | $9,385 +11.3% | $50,000 +22.1% |
| 2020 | $8,434 +2.1% | $40,963 -8% |
| 2019 | $8,257 +1.7% | $44,526 |
| 2018 | $8,117 +13.2% | $44,526 +21.4% |
| 2017 | $7,171 +4.7% | $36,687 |
| 2016 | $6,848 +9.7% | $36,687 |
| 2015 | $6,242 -3.8% | $36,687 -2.3% |
| 2014 | $6,492 +2.2% | $37,557 |
| 2013 | $6,352 +1% | $37,557 |
| 2012 | $6,292 -1.8% | $37,557 -19.4% |
| 2011 | $6,410 -15.4% | $46,577 |
| 2010 | $7,579 +66.1% | $46,577 |
| 2009 | $4,563 -19.8% | $46,577 -2.4% |
| 2008 | $5,688 +3.8% | $47,710 |
| 2007 | $5,478 +9.7% | $47,710 |
| 2006 | $4,993 -4.1% | $47,710 +21.7% |
| 2005 | $5,208 +2.4% | $39,194 |
| 2004 | $5,084 +3.4% | $39,194 |
| 2003 | $4,915 +8.7% | $39,194 +45.1% |
| 2002 | $4,524 +4.6% | $27,003 |
| 2001 | $4,326 +21% | $27,003 |
| 2000 | $3,575 -0.3% | $27,003 +31% |
| 1999 | $3,587 | $20,610 |
Source: MRED as distributed by MLS GRID. This data may not be complete. We recommend contacting the local school district to confirm school assignments for this home.