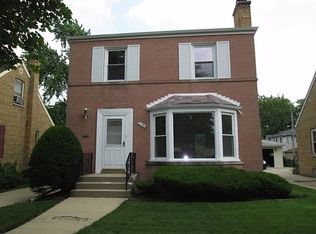
$386,400
2 bd|1 ba|1k sqft
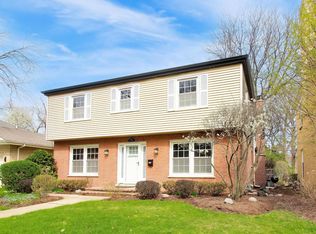
7175 N Mankato Ave, Chicago, IL 60646
Off Market
Zillow last checked:
Listing updated:
Philip Barone 312-952-7962,
Compass,
Maureen Barone,
Compass
$677,000
$643,000 - $711,000
$3,931/mo
| Date | Event | Price |
|---|---|---|
| 4/15/2026 | Listed for sale | $695,000+5.8%$323/sqft |
Source: | ||
| 10/5/2023 | Sold | $657,000-3.2%$306/sqft |
Source: | ||
| 8/25/2023 | Pending sale | $679,000$316/sqft |
Source: | ||
| 7/12/2023 | Listed for sale | $679,000+13.4%$316/sqft |
Source: | ||
| 6/8/2023 | Listing removed | -- |
Source: | ||
| 12/6/2022 | Listing removed | $599,000$279/sqft |
Source: | ||
| 11/19/2022 | Price change | $599,000-1.6%$279/sqft |
Source: | ||
| 10/18/2022 | Price change | $609,000-3.2%$283/sqft |
Source: | ||
| 9/17/2022 | Price change | $629,000-1.6%$293/sqft |
Source: | ||
| 9/2/2022 | Price change | $639,000-1.5%$297/sqft |
Source: | ||
| 7/11/2022 | Price change | $649,000-4.4%$302/sqft |
Source: | ||
| 7/6/2022 | Listed for sale | $679,000+105.8%$316/sqft |
Source: | ||
| 4/14/2022 | Sold | $330,000-5.4%$153/sqft |
Source: | ||
| 3/21/2022 | Contingent | $349,000$162/sqft |
Source: | ||
| 3/21/2022 | Listed for sale | $349,000$162/sqft |
Source: | ||
| Year | Property taxes | Tax assessment |
|---|---|---|
| 2023 | $8,788 +2.6% | $41,650 |
| 2022 | $8,567 -3.2% | $41,650 -5.3% |
| 2021 | $8,848 +41.8% | $44,000 +30.9% |
| 2020 | $6,242 +2.4% | $33,602 -8% |
| 2019 | $6,098 +39.4% | $36,524 |
| 2018 | $4,374 -6.6% | $36,524 +9.7% |
| 2017 | $4,683 -7% | $33,286 |
| 2016 | $5,034 +4% | $33,286 |
| 2015 | $4,838 +0.9% | $33,286 +7.5% |
| 2014 | $4,796 -0.4% | $30,973 |
| 2013 | $4,813 +0.5% | $30,973 |
| 2012 | $4,790 +21.5% | $30,973 -13.7% |
| 2011 | $3,942 +18.8% | $35,899 |
| 2010 | $3,317 +14.5% | $35,899 |
| 2009 | $2,897 +0.3% | $35,899 -13.8% |
| 2008 | $2,889 +5.8% | $41,656 |
| 2007 | $2,731 -25.7% | $41,656 |
| 2006 | $3,674 +28.5% | $41,656 +69.4% |
| 2005 | $2,860 +2.4% | $24,590 |
| 2004 | $2,794 -9.2% | $24,590 -14% |
| 2003 | $3,078 +79.7% | $28,600 +53.6% |
| 2002 | $1,713 -6.6% | $18,624 |
| 2001 | $1,833 -30.9% | $18,624 |
| 2000 | $2,652 +0% | $18,624 +10.1% |
| 1999 | $2,652 | $16,917 |
Source: MRED as distributed by MLS GRID. This data may not be complete. We recommend contacting the local school district to confirm school assignments for this home.
A local agent can set up tours, give advice and negotiate with sellers.
A local lender can help you make sure your offer is ready when you are.