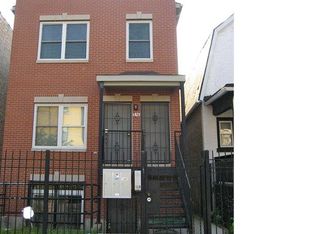
$213,600
3 bd|2 ba|1.2k sqft
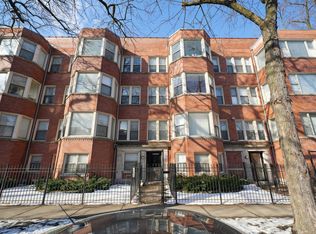
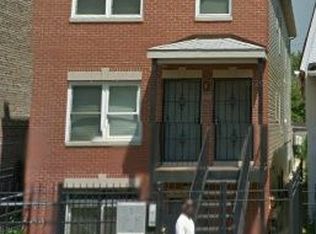
6823 S Dorchester Ave #1, Chicago, IL 60637
Off Market
Zillow last checked:
Listing updated:
Nicole Blow 312-588-9300,
HomeSmart Realty Group
Not available
Estimated sales range
Not available
Not available
| Date | Event | Price |
|---|---|---|
| 4/13/2026 | Listed for sale | $219,000$156/sqft |
Source: | ||
| 11/5/2025 | Listing removed | $219,000$156/sqft |
Source: | ||
| 9/23/2025 | Listed for sale | $219,000$156/sqft |
Source: | ||
| 9/23/2025 | Listing removed | $219,000$156/sqft |
Source: | ||
| 9/9/2025 | Contingent | $219,000$156/sqft |
Source: | ||
| 8/25/2025 | Listed for sale | $219,000-0.5%$156/sqft |
Source: | ||
| 12/10/2024 | Listing removed | -- |
Source: Owner Report a problem | ||
| 9/11/2024 | Listed for sale | $220,000+29.8%$157/sqft |
Source: Owner Report a problem | ||
| 10/11/2019 | Listing removed | $1,250$1/sqft |
Source: Go Section8 Report a problem | ||
| 9/11/2019 | Listed for rent | $1,250+4.2%$1/sqft |
Source: Go Section8 Report a problem | ||
| 6/15/2015 | Listing removed | $1,200$1/sqft |
Source: Lofty Report a problem | ||
| 6/5/2015 | Listed for rent | $1,200+9.1%$1/sqft |
Source: Lofty Report a problem | ||
| 4/8/2014 | Listing removed | $1,100$1/sqft |
Source: Coldwell Banker Residential Brokerage - Hyde Park #08539607 Report a problem | ||
| 2/20/2014 | Listed for rent | $1,100$1/sqft |
Source: Coldwell Banker Residential Brokerage - Hyde Park #08539607 Report a problem | ||
| 6/29/2007 | Sold | $169,500$121/sqft |
Source: | ||
| Year | Property taxes | Tax assessment |
|---|---|---|
| 2023 | $2,686 +3.8% | $15,999 |
| 2022 | $2,587 +1.6% | $15,999 |
| 2021 | $2,548 +99.1% | $15,999 +80.9% |
| 2020 | $1,280 +0.8% | $8,846 -9.2% |
| 2019 | $1,269 +1.8% | $9,747 |
| 2018 | $1,247 +18.8% | $9,747 +18.1% |
| 2017 | $1,049 -8.9% | $8,250 |
| 2016 | $1,152 +11.7% | $8,250 |
| 2015 | $1,031 -39.5% | $8,250 -29.8% |
| 2014 | $1,705 +2.7% | $11,756 |
| 2013 | $1,660 -0.1% | $11,756 |
| 2012 | $1,662 -15.8% | $11,756 -17.2% |
| 2011 | $1,974 -2% | $14,201 |
| 2010 | $2,015 +4% | $14,201 |
| 2009 | $1,937 -10.9% | $14,201 -16.5% |
| 2008 | $2,174 -10% | $16,999 |
| 2007 | $2,414 -1.1% | $16,999 |
| 2006 | $2,440 | $16,999 |
Source: MRED as distributed by MLS GRID. This data may not be complete. We recommend contacting the local school district to confirm school assignments for this home.
A local agent can set up tours, give advice and negotiate with sellers.