$248,400
2 bd|2 ba|1k sqft
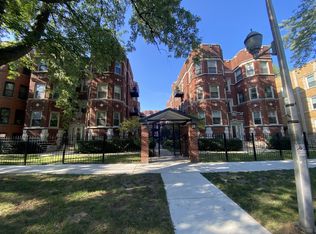
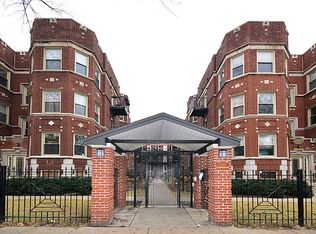
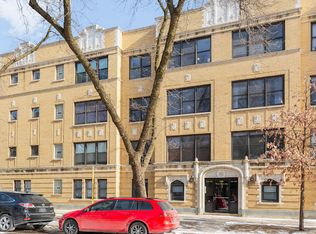
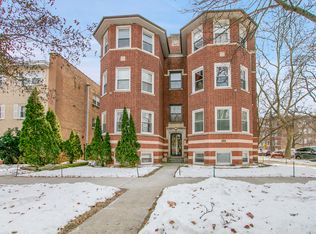
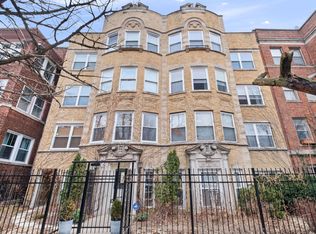
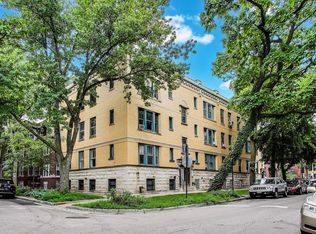
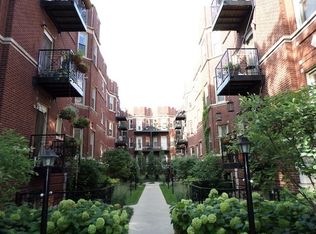
1332 W Greenleaf Ave APT 1B, Chicago, IL 60626
Off Market
Likely to sell faster than
Zillow last checked: 8 hours ago
Listing updated: January 12, 2026 at 05:46am
Donna Agnew 847-866-7041,
@properties Christie's International Real Estate
$252,600
$240,000 - $265,000
$2,189/mo
| Date | Event | Price |
|---|---|---|
| 1/12/2026 | Contingent | $250,000 |
Source: | ||
| 1/8/2026 | Listed for sale | $250,000+51.5% |
Source: | ||
| 11/28/2024 | Listing removed | $1,850 |
Source: Zillow Rentals Report a problem | ||
| 11/28/2024 | Price change | $1,850-6.3% |
Source: Zillow Rentals Report a problem | ||
| 10/22/2024 | Price change | $1,975-6% |
Source: Zillow Rentals Report a problem | ||
| 10/16/2024 | Price change | $2,100-4.5% |
Source: Zillow Rentals Report a problem | ||
| 10/2/2024 | Listed for rent | $2,200 |
Source: Zillow Rentals Report a problem | ||
| 12/29/2017 | Sold | $165,000-0.5% |
Source: | ||
| 11/20/2017 | Pending sale | $165,900 |
Source: @properties #09744546 Report a problem | ||
| 11/9/2017 | Price change | $165,900-6% |
Source: @properties #09744546 Report a problem | ||
| 10/21/2017 | Price change | $176,400-1.1% |
Source: @properties #09744546 Report a problem | ||
| 10/14/2017 | Pending sale | $178,400 |
Source: @properties #09744546 Report a problem | ||
| 9/26/2017 | Price change | $178,400-3.6% |
Source: @properties #09744546 Report a problem | ||
| 9/8/2017 | Listed for sale | $185,000+105.6% |
Source: @properties #09744546 Report a problem | ||
| 12/8/2010 | Sold | $90,000-61.2% |
Source: Public Record Report a problem | ||
| 1/7/2009 | Sold | $232,000-1.5% |
Source: Public Record Report a problem | ||
| 2/28/2007 | Sold | $235,505 |
Source: | ||
| Year | Property taxes | Tax assessment |
|---|---|---|
| 2023 | $3,368 +2.6% | $15,965 |
| 2022 | $3,284 -9.3% | $15,965 -11.3% |
| 2021 | $3,619 +33.7% | $17,999 +48.2% |
| 2020 | $2,706 -0.5% | $12,149 -10.3% |
| 2019 | $2,721 +1.7% | $13,543 |
| 2018 | $2,675 +1.9% | $13,543 +11.1% |
| 2017 | $2,625 +7.5% | $12,192 |
| 2016 | $2,442 +5.3% | $12,192 -3.6% |
| 2015 | $2,318 -12.1% | $12,651 -11% |
| 2014 | $2,639 +2% | $14,221 |
| 2013 | $2,586 +1.4% | $14,221 |
| 2012 | $2,552 -20.5% | $14,221 -28.2% |
| 2011 | $3,211 -0.4% | $19,813 |
| 2010 | $3,224 +4.4% | $19,813 |
| 2009 | $3,090 -9.1% | $19,813 -16.3% |
| 2008 | $3,397 +23.4% | $23,683 +22.1% |
| 2007 | $2,754 | $19,389 |
Source: MRED as distributed by MLS GRID. This data may not be complete. We recommend contacting the local school district to confirm school assignments for this home.