$156,200
6 bd|2 ba|2.3k sqft
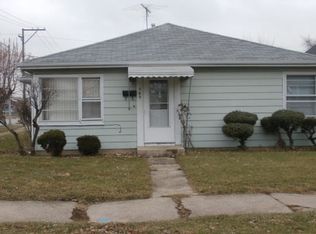
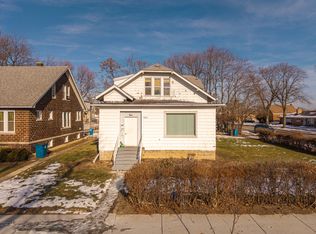
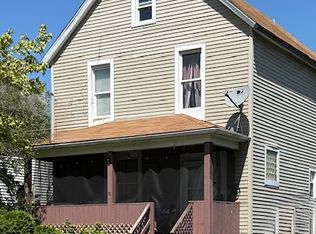
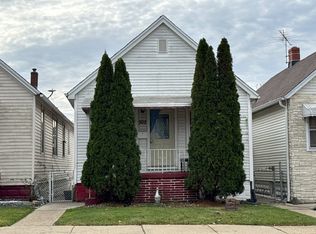
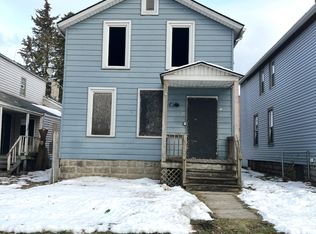
157 E 25th St, Chicago Heights, IL 60411
Off Market
Zillow last checked: 8 hours ago
Listing updated: February 25, 2026 at 10:09am
Jeremy Slowinski, CRS 708-670-2032,
Ellsbury Group LLC
$125,300
$119,000 - $132,000
$1,418/mo
| Date | Event | Price |
|---|---|---|
| 2/25/2026 | Contingent | $129,000 |
Source: | ||
| 1/7/2026 | Listed for sale | $129,000-7.7% |
Source: | ||
| 11/21/2025 | Listing removed | $139,700 |
Source: | ||
| 11/17/2025 | Contingent | $139,700 |
Source: | ||
| 10/3/2025 | Price change | $139,700-0.1% |
Source: | ||
| 9/26/2025 | Price change | $139,800-0.1% |
Source: | ||
| 7/16/2025 | Price change | $139,900-4.1% |
Source: | ||
| 6/16/2025 | Price change | $145,900-2.7% |
Source: | ||
| 6/4/2025 | Price change | $149,900-6.3% |
Source: | ||
| 4/21/2025 | Price change | $159,900-3% |
Source: | ||
| 4/11/2025 | Listed for sale | $164,900-2.9% |
Source: | ||
| 4/11/2025 | Listing removed | $169,900 |
Source: | ||
| 3/18/2025 | Listed for sale | $169,900 |
Source: | ||
| 3/17/2025 | Contingent | $169,900 |
Source: | ||
| 3/11/2025 | Listed for sale | $169,900+6.3% |
Source: | ||
| 2/21/2025 | Listing removed | $159,900 |
Source: | ||
| 2/18/2025 | Listed for sale | $159,900-18% |
Source: | ||
| 8/28/2024 | Listing removed | $194,900 |
Source: | ||
| 8/21/2024 | Price change | $194,900-2% |
Source: | ||
| 8/13/2024 | Price change | $198,900-0.5% |
Source: | ||
| 7/13/2024 | Price change | $199,900-4.8% |
Source: | ||
| 6/25/2024 | Listed for sale | $209,900+19.9% |
Source: | ||
| 3/1/2024 | Sold | $175,000+42.9% |
Source: Agent Provided Report a problem | ||
| 9/21/2022 | Sold | $122,500-5.7% |
Source: | ||
| 6/22/2022 | Contingent | $129,900 |
Source: | ||
| 6/11/2022 | Listed for sale | $129,900+145.1% |
Source: | ||
| 7/3/2001 | Sold | $53,000 |
Source: Public Record Report a problem | ||
| Year | Property taxes | Tax assessment |
|---|---|---|
| 2023 | $4,182 +0.4% | $7,866 +19.3% |
| 2022 | $4,167 +4.1% | $6,593 |
| 2021 | $4,002 +3.3% | $6,593 |
| 2020 | $3,874 -7% | $6,593 -8.9% |
| 2019 | $4,167 +5.2% | $7,236 |
| 2018 | $3,962 +4.6% | $7,236 |
| 2017 | $3,787 +36.6% | $7,236 +40% |
| 2016 | $2,772 +1.2% | $5,170 |
| 2015 | $2,741 +0.9% | $5,170 |
| 2014 | $2,716 -8% | $5,170 -11.4% |
| 2013 | $2,952 +3.2% | $5,835 |
| 2012 | $2,861 +9.7% | $5,835 |
| 2011 | $2,608 -4.5% | $5,835 -14.5% |
| 2010 | $2,732 +3.5% | $6,826 |
| 2009 | $2,640 +14.7% | $6,826 -5% |
| 2008 | $2,301 -2% | $7,186 +2.4% |
| 2007 | $2,349 -0.2% | $7,020 |
| 2006 | $2,353 +0.4% | $7,020 |
| 2005 | $2,345 +25.7% | $7,020 +27% |
| 2004 | $1,865 +3.2% | $5,526 |
| 2003 | $1,807 -5.8% | $5,526 |
| 2002 | $1,918 +0.7% | $5,526 +0.7% |
| 2001 | $1,905 +1% | $5,488 |
| 2000 | $1,887 | $5,488 |
| 1999 | $1,887 | $5,488 |
Source: MRED as distributed by MLS GRID. This data may not be complete. We recommend contacting the local school district to confirm school assignments for this home.