$183,800
3 bd|1 ba|1.2k sqft
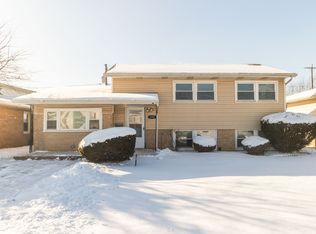
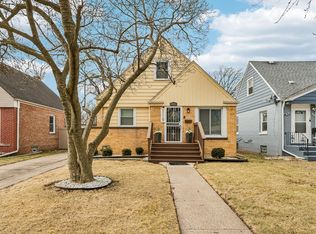
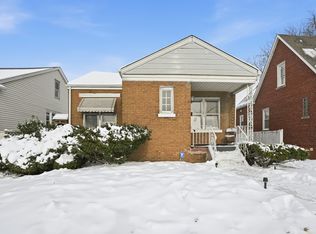
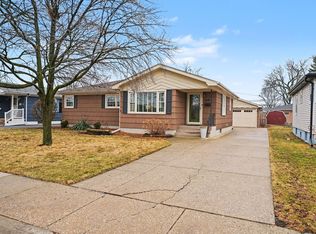
271 Cornell Ave, Calumet City, IL 60409
Off Market
Zillow last checked: 7 hours ago
Listing updated: March 10, 2026 at 10:07pm
Lena Matariyeh 708-737-4444,
@properties Christie's International Real Estate
Not available
Estimated sales range
Not available
Not available
| Date | Event | Price |
|---|---|---|
| 3/5/2026 | Price change | $259,000-3.7%$200/sqft |
Source: | ||
| 2/17/2026 | Listed for sale | $269,000+77%$207/sqft |
Source: | ||
| 2/25/2019 | Sold | $152,000-2.6%$117/sqft |
Source: | ||
| 1/7/2019 | Pending sale | $156,000$120/sqft |
Source: Chicago Realty Associates Inc #10061966 Report a problem | ||
| 12/11/2018 | Price change | $156,000-1.3%$120/sqft |
Source: Chicago Realty Associates Inc #10061966 Report a problem | ||
| 11/14/2018 | Price change | $158,000-1.2%$122/sqft |
Source: Chicago Realty Associates Inc #10061966 Report a problem | ||
| 10/31/2018 | Price change | $159,900-3%$123/sqft |
Source: Chicago Realty Associates Inc #10061966 Report a problem | ||
| 10/16/2018 | Price change | $164,900-0.6%$127/sqft |
Source: Chicago Realty Associates Inc #10061966 Report a problem | ||
| 9/28/2018 | Price change | $165,900-2.4%$128/sqft |
Source: Chicago Realty Associates Inc #10061966 Report a problem | ||
| 8/24/2018 | Listed for sale | $169,900+142.7%$131/sqft |
Source: Chicago Realty Associates Inc #10061966 Report a problem | ||
| 4/27/2018 | Sold | $70,000-21.3%$54/sqft |
Source: | ||
| 3/24/2018 | Pending sale | $89,000$69/sqft |
Source: Coldwell Banker The Real Estate Group #09843549 Report a problem | ||
| 1/29/2018 | Listed for sale | $89,000$69/sqft |
Source: Coldwell Banker Honig-Bell #09843549 Report a problem | ||
| 11/3/2017 | Listing removed | $89,000$69/sqft |
Source: Coldwell Banker The Real Estate Group #09766008 Report a problem | ||
| 10/2/2017 | Listed for sale | $89,000-29.6%$69/sqft |
Source: Coldwell Banker Honig-Bell #09766008 Report a problem | ||
| 3/18/2013 | Sold | $126,500+175%$97/sqft |
Source: Public Record Report a problem | ||
| 7/9/2012 | Sold | $46,000+9.5%$35/sqft |
Source: Public Record Report a problem | ||
| 10/6/2011 | Sold | $42,000-14.1%$32/sqft |
Source: Public Record Report a problem | ||
| 8/18/2011 | Price change | $48,900-7.6%$38/sqft |
Source: Meeker Real Estate, Inc. #07865488 Report a problem | ||
| 7/29/2011 | Listed for sale | $52,900$41/sqft |
Source: Meeker Real Estate, Inc. #07865488 Report a problem | ||
| Year | Property taxes | Tax assessment |
|---|---|---|
| 2023 | $8,546 +28% | $17,000 +43.4% |
| 2022 | $6,675 +5% | $11,852 |
| 2021 | $6,354 +6.8% | $11,852 |
| 2020 | $5,947 -22.8% | $11,852 +13.6% |
| 2019 | $7,702 +0.4% | $10,433 |
| 2018 | $7,669 +4.3% | $10,433 |
| 2017 | $7,351 +1.2% | $10,433 -4.2% |
| 2016 | $7,267 -9.4% | $10,893 -11.5% |
| 2015 | $8,018 +2.8% | $12,305 |
| 2014 | $7,803 +4.2% | $12,305 -2.4% |
| 2013 | $7,489 +21.8% | $12,610 -6.1% |
| 2012 | $6,147 +2.4% | $13,424 |
| 2011 | $6,002 +30.2% | $13,424 -7.2% |
| 2010 | $4,612 +15.1% | $14,459 |
| 2009 | $4,008 +7.2% | $14,459 -5% |
| 2008 | $3,741 +2.2% | $15,220 +6.8% |
| 2007 | $3,662 +12.3% | $14,245 |
| 2006 | $3,262 +4.6% | $14,245 |
| 2005 | $3,118 +1.5% | $14,245 +32.7% |
| 2004 | $3,073 +3% | $10,734 |
| 2003 | $2,983 -25.4% | $10,734 -13.3% |
| 2002 | $3,998 +36.3% | $12,383 +10.1% |
| 2001 | $2,932 +4.3% | $11,252 |
| 2000 | $2,811 +5.1% | $11,252 |
| 1999 | $2,676 | $11,252 |
Find assessor info on the county website
Source: MRED as distributed by MLS GRID. This data may not be complete. We recommend contacting the local school district to confirm school assignments for this home.