$742,700
4 bd|-- ba|3.6k sqft
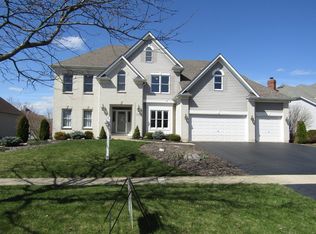
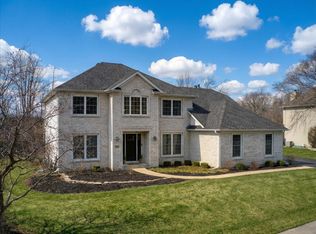
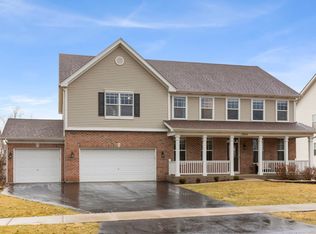
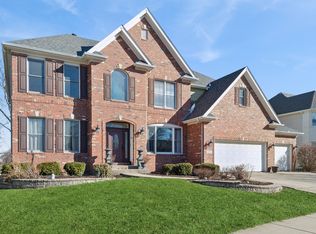
1823 Burnell Ct, Batavia, IL 60510
Off Market
Zillow last checked: 7 hours ago
Listing updated: 9 hours ago
Cindy Pierce 630-669-9849,
Baird & Warner
Not available
Estimated sales range
Not available
Not available
| Date | Event | Price |
|---|---|---|
| 3/10/2026 | Price change | $725,000+63.3%$231/sqft |
Source: | ||
| 8/15/2014 | Price change | $443,900-1.1%$141/sqft |
Source: Baird & Warner Real Estate #08595594 Report a problem | ||
| 7/19/2014 | Price change | $448,900-0.2%$143/sqft |
Source: Baird & Warner Real Estate #08595594 Report a problem | ||
| 7/2/2014 | Price change | $450,000-2.2%$143/sqft |
Source: Baird & Warner Real Estate #08595594 Report a problem | ||
| 6/18/2014 | Price change | $459,900-1.1%$146/sqft |
Source: Baird & Warner Real Estate #08595594 Report a problem | ||
| 5/22/2014 | Price change | $465,000-2.1%$148/sqft |
Source: Baird & Warner Real Estate #08595594 Report a problem | ||
| 4/26/2014 | Price change | $475,000-2.1%$151/sqft |
Source: Baird & Warner Real Estate #08595594 Report a problem | ||
| 3/29/2014 | Listed for sale | $485,000+3%$154/sqft |
Source: Baird & Warner #08569466 Report a problem | ||
| 6/13/2005 | Sold | $471,000+19.2%$150/sqft |
Source: Public Record Report a problem | ||
| 9/13/2000 | Sold | $395,000+480.9%$126/sqft |
Source: Public Record Report a problem | ||
| 4/10/1997 | Sold | $68,000$22/sqft |
Source: Public Record Report a problem | ||
| Year | Property taxes | Tax assessment |
|---|---|---|
| 2024 | $14,765 +2% | $194,740 +10.2% |
| 2023 | $14,480 +4.2% | $176,747 +7% |
| 2022 | $13,900 +4.1% | $165,184 +5.4% |
| 2021 | $13,356 +2.5% | $156,662 +2% |
| 2020 | $13,031 +1.6% | $153,651 +3.7% |
| 2019 | $12,825 +2.3% | $148,211 +2.3% |
| 2018 | $12,532 +2.4% | $144,890 +3.4% |
| 2017 | $12,236 -2.4% | $140,112 +3% |
| 2016 | $12,534 | $136,031 +2.3% |
| 2015 | -- | $132,934 +3.3% |
| 2014 | -- | $128,749 -8.6% |
| 2013 | -- | $140,918 -2.9% |
| 2012 | -- | $145,136 -3.4% |
| 2011 | -- | $150,228 -4% |
| 2010 | -- | $156,485 -11.2% |
| 2009 | -- | $176,296 +0.3% |
| 2008 | -- | $175,714 +6.5% |
| 2007 | -- | $165,005 +5.5% |
| 2006 | -- | $156,344 +3.3% |
| 2005 | -- | $151,320 +21.5% |
| 2004 | -- | $124,552 +6.9% |
| 2003 | -- | $116,556 +5.8% |
| 2002 | -- | $110,141 +5.2% |
| 2001 | -- | $104,657 +2.4% |
| 2000 | -- | $102,204 |
Source: MRED as distributed by MLS GRID. This data may not be complete. We recommend contacting the local school district to confirm school assignments for this home.