$301,600
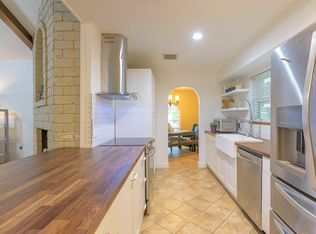
3 bd|1 ba|1.8k sqft
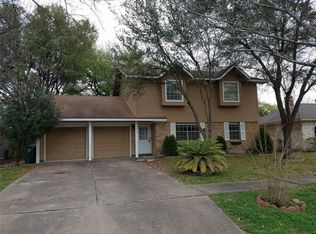
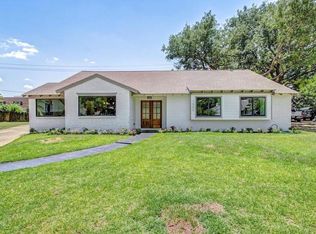
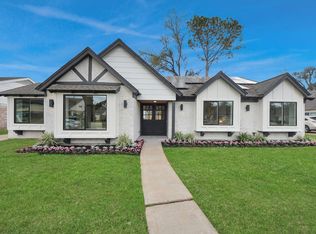
9610 Springmont Dr, Houston, TX 77080
Off Market
Likely to sell faster than
Zillow last checked: 7 hours ago
Listing updated: March 11, 2026 at 02:04am
Meshi Slama TREC #0800878 979-422-0895,
Nextgen Real Estate Properties
$573,500
$545,000 - $602,000
$3,114/mo
| Date | Event | Price |
|---|---|---|
| 3/10/2026 | Listed for sale | $600,000+55.8%$275/sqft |
Source: | ||
| 3/3/2026 | Listing removed | $8,950$4/sqft |
Source: Zillow Rentals Report a problem | ||
| 1/3/2025 | Listed for rent | $8,950$4/sqft |
Source: Zillow Rentals Report a problem | ||
| 9/14/2024 | Listing removed | $385,000$177/sqft |
Source: | ||
| 8/12/2024 | Pending sale | $385,000$177/sqft |
Source: | ||
| 7/11/2024 | Price change | $385,000-3.5%$177/sqft |
Source: | ||
| 5/9/2024 | Listed for sale | $399,000-3.9%$183/sqft |
Source: | ||
| 5/8/2024 | Listing removed | -- |
Source: | ||
| 4/24/2024 | Listed for sale | $415,000$190/sqft |
Source: | ||
| 4/24/2024 | Listing removed | -- |
Source: | ||
| 4/16/2024 | Price change | $415,000-5.7%$190/sqft |
Source: | ||
| 3/21/2024 | Listed for sale | $440,000+184.1%$202/sqft |
Source: | ||
| 10/18/2012 | Listing removed | $154,900$71/sqft |
Source: Heritage Texas Properties #73088914 Report a problem | ||
| 10/11/2012 | Price change | $154,900-1.3%$71/sqft |
Source: Heritage Texas Properties #73088914 Report a problem | ||
| 8/25/2012 | Price change | $156,900-1.9%$72/sqft |
Source: Heritage Texas Properties #73088914 Report a problem | ||
| 8/5/2012 | Price change | $159,900-3%$73/sqft |
Source: Heritage Texas Properties #73088914 Report a problem | ||
| 7/3/2012 | Price change | $164,900-2.4%$76/sqft |
Source: Heritage Texas Properties #73088914 Report a problem | ||
| 5/12/2012 | Listed for sale | $168,999$78/sqft |
Source: Heritage Texas Properties #73088914 Report a problem | ||
| Year | Property taxes | Tax assessment |
|---|---|---|
| 2025 | -- | $360,083 +24.6% |
| 2024 | $2,608 +12.2% | $289,016 +4.8% |
| 2023 | $2,325 +6.2% | $275,680 +4.5% |
| 2022 | $2,190 | $263,712 +13.3% |
| 2021 | -- | $232,783 +8.8% |
| 2020 | $1,996 -1.6% | $213,987 |
| 2019 | $2,028 -43.6% | $213,987 +2.5% |
| 2018 | $3,595 | $208,807 |
| 2017 | $3,595 +11% | $208,807 +6.1% |
| 2016 | $3,240 +15.4% | $196,886 |
| 2015 | $2,808 | $196,886 +23.3% |
| 2014 | $2,808 | $159,624 +23.9% |
| 2013 | -- | $128,821 |
| 2012 | -- | $128,821 +8% |
| 2011 | -- | $119,281 -11.7% |
| 2010 | -- | $135,096 -2.6% |
| 2009 | -- | $138,750 |
| 2008 | -- | $138,750 +1.6% |
| 2007 | -- | $136,523 |
| 2006 | -- | $136,523 +1.8% |
| 2005 | -- | $134,107 +2.9% |
| 2004 | -- | $130,300 +10% |
| 2003 | -- | $118,500 +9.9% |
| 2002 | -- | $107,800 +10% |
| 2001 | -- | $98,000 +13% |
| 2000 | -- | $86,700 |
Find assessor info on the county website
Source: HAR. This data may not be complete. We recommend contacting the local school district to confirm school assignments for this home.