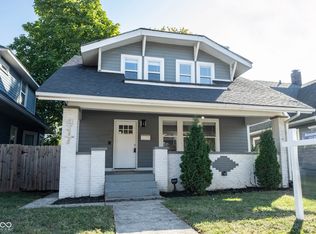
915 North Rural St.
This property is off market, which means it's not currently listed for sale or rent on Zillow. This may be different from what's available on other websites or public sources.
$201,500
$177,000 - $224,000
$1,546/mo
List your home for rent
$1,546/mo
Rent Zestimate®
Find your next renter with Zillow Rental Manager. Plus, with online applications, you can quickly screen prospective tenants – for free.
Learn more$1,546/mo
Rent Zestimate®
Refinance and save
$1,286/mo
Est. payment
Refinancing to a lower rate could help reduce your monthly payments and save thousands over the life of the loan.
See today's rates$1,286/mo
Est. payment
Work with a Zillow partner agent
Leverage their expertise and Zillow's premium Showcase listings to get your home seen by more buyers.
Get startedList with your own agent
Get your home in front of millions of buyers by listing it on Zillow.
Learn how to do itSell it yourself
Take full control of how buyers see your home on Zillow by listing For Sale by Owner (FSBO).
List your home915 North Rural St.
This property is off market, which means it's not currently listed for sale or rent on Zillow. This may be different from what's available on other websites or public sources.
| Date | Event | Price |
|---|---|---|
| 6/24/2021 | Sold | $175,000-2.7%$104/sqft |
Source: | ||
| 5/25/2021 | Pending sale | $179,900$107/sqft |
Source: | ||
| 5/14/2021 | Listed for sale | $179,900+28.5%$107/sqft |
Source: | ||
| 8/22/2020 | Listing removed | $1,300$1/sqft |
Source: PMI Indianapolis Report a problem | ||
| 7/27/2020 | Listed for rent | $1,300-13.3%$1/sqft |
Source: PMI Indianapolis Report a problem | ||
| 7/16/2019 | Listing removed | $1,500+7.1%$1/sqft |
Source: Owner Report a problem | ||
| 7/9/2019 | Listed for rent | $1,400$1/sqft |
Source: Owner Report a problem | ||
| 5/15/2019 | Sold | $140,000-13.6%$83/sqft |
Source: | ||
| 4/15/2019 | Pending sale | $162,000$96/sqft |
Source: MIBOR REALTOR Association #21589494 Report a problem | ||
| 3/13/2019 | Price change | $162,000-7.4%$96/sqft |
Source: MIBOR REALTOR Association #21589494 Report a problem | ||
| 8/15/2018 | Listed for sale | $174,900+118.6%$104/sqft |
Source: Nottingham Realty Group #21589494 Report a problem | ||
| 8/4/2016 | Sold | $80,000-5.8%$48/sqft |
Source: | ||
| 7/10/2016 | Pending sale | $84,900$50/sqft |
Source: Ala Carte Realty #21413546 Report a problem | ||
| 4/25/2016 | Listed for sale | $84,900+553.1%$50/sqft |
Source: Ala Carte Realty #21413546 Report a problem | ||
| 8/11/2015 | Sold | $13,000+73.3%$8/sqft |
Source: Public Record Report a problem | ||
| 1/17/2014 | Sold | $7,500-77.9%$4/sqft |
Source: Public Record Report a problem | ||
| 5/27/2011 | Listing removed | $34,000$20/sqft |
Source: Turn Key Homes LLC Report a problem | ||
| 3/30/2011 | Listed for sale | $34,000-2.6%$20/sqft |
Source: Turn Key Homes LLC Report a problem | ||
| 5/23/2008 | Listing removed | $34,900$21/sqft |
Source: Century 21 #2752834 Report a problem | ||
| 3/5/2008 | Listed for sale | $34,900$21/sqft |
Source: Century 21 #2752834 Report a problem | ||
| Year | Property taxes | Tax assessment |
|---|---|---|
| 2024 | $1,794 -7.6% | $153,800 -2.7% |
| 2023 | $1,942 +18.8% | $158,000 -5.2% |
| 2022 | $1,634 -43.7% | $166,700 +15.4% |
| 2021 | $2,904 +188.1% | $144,500 +15.2% |
| 2020 | $1,008 +31% | $125,400 +22.6% |
| 2019 | $770 +66.6% | $102,300 +15.3% |
| 2018 | $462 +11.5% | $88,700 +20.4% |
| 2017 | $414 -8.3% | $73,700 +16.4% |
| 2016 | $451 +17.3% | $63,300 +20.1% |
| 2014 | $385 -63.4% | $52,700 -14% |
| 2013 | $1,052 | $61,300 +30.7% |
| 2012 | $1,052 | $46,900 -7.9% |
| 2011 | -- | $50,900 |
| 2010 | $1,058 -2.5% | $50,900 |
| 2009 | $1,085 | $50,900 |
| 2007 | -- | $50,900 +173.7% |
| 2002 | -- | $18,600 +200% |
| 2001 | -- | $6,200 |
| 2000 | -- | $6,200 |
Find assessor info on the county website
Source: The MLS. This data may not be complete. We recommend contacting the local school district to confirm school assignments for this home.