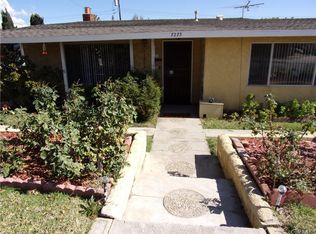
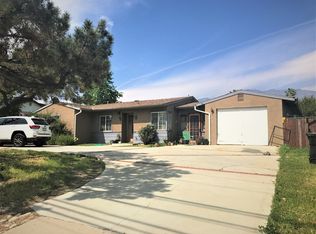
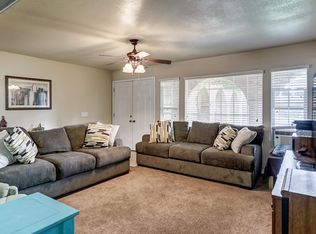
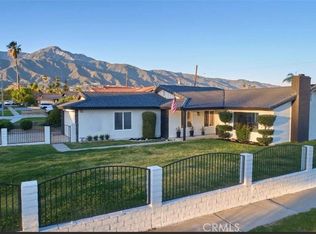
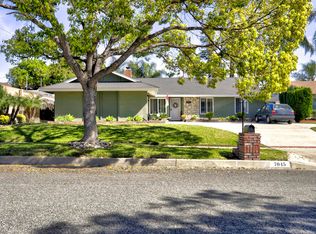
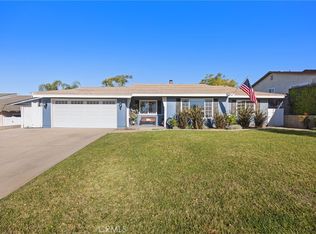
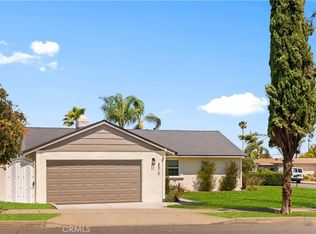
NEWLY COMPLETELY REMODELED! See photos! All interior redone completely with new flooring, new windows and doors, new appliances... per prior appraisal it offers 4 bedrooms, 2 baths, about 2000 sqft. and more on about an acre of land. Walk to Alta Loma High School, make a great home, especially for dog lovers - pets will be considered; extra deposit will apply. "What a big backyard!" you'll say to yourself every time you look out one of these new windows! New Kitchen features granite countertops, stainless steel sink and more. No carpet -easy-to-clean flooring.
Pre-foreclosure
Est. $834,600
9038 Baseline Rd, Rancho Cucamonga, CA 91701
4beds
2baths
1,068sqft
SingleFamily
Built in 1952
1 Acres Lot
$834,600 Zestimate®
$781/sqft
$-- HOA
Overview
- 290 days |
- 35 |
- 0 |
Facts & features
Interior
Bedrooms & bathrooms
- Bedrooms: 4
- Bathrooms: 2
Heating
- Wall
Cooling
- None
Features
- Has fireplace: Yes
Interior area
- Total interior livable area: 1,068 sqft
Property
Parking
- Total spaces: 2
- Parking features: Garage - Detached
Lot
- Size: 1 Acres
Details
- Parcel number: 0202231300000
Construction
Type & style
- Home type: SingleFamily
Materials
- wood frame
- Roof: Tile
Condition
- Year built: 1952
Community & HOA
Location
- Region: Rancho Cucamonga
Financial & listing details
- Price per square foot: $781/sqft
- Tax assessed value: $347,201
- Annual tax amount: $3,874
Visit our professional directory to find a foreclosure specialist in your area that can help with your home search.
Find a foreclosure agentForeclosure details
Estimated market value
$834,600
$785,000 - $885,000
$3,251/mo
Price history
Price history
| Date | Event | Price |
|---|---|---|
| 5/22/2011 | Listing removed | $1,850$2/sqft |
Source: Empire Estates Inc/ DBA Prudential Ca Realty #C11058900 Report a problem | ||
| 5/11/2011 | Listed for rent | $1,850$2/sqft |
Source: Empire Estates Inc/ DBA Prudential Ca Realty #C11058900 Report a problem | ||
| 10/27/2010 | Listing removed | $269,900$253/sqft |
Source: Millienia Real Estate Services, Inc. #C10061698 Report a problem | ||
| 8/27/2010 | Listed for sale | $269,900-0.4%$253/sqft |
Source: Millienia Real Estate Services, Inc. #C10061698 Report a problem | ||
| 7/22/2010 | Sold | $271,000+0.4%$254/sqft |
Source: Public Record Report a problem | ||
| 6/11/2010 | Listed for sale | $269,900-3.6%$253/sqft |
Source: foreclosure.com Report a problem | ||
| 5/17/2010 | Sold | $279,865-1.1%$262/sqft |
Source: Public Record Report a problem | ||
| 5/14/2010 | Listed for sale | $283,000+28.6%$265/sqft |
Source: FIRST TEAM REAL ESTATE #C10032228 Report a problem | ||
| 11/19/2009 | Listing removed | $220,000$206/sqft |
Source: Century 21 Masters #C09112874 Report a problem | ||
| 10/24/2009 | Listed for sale | $220,000-60%$206/sqft |
Source: Century 21 Masters #C09112874 Report a problem | ||
| 10/16/2008 | Listing removed | $550,000$515/sqft |
Source: Listhub #S533751 Report a problem | ||
| 6/3/2008 | Listed for sale | $550,000+333.1%$515/sqft |
Source: Listhub #S533751 Report a problem | ||
| 1/17/1996 | Sold | $127,000-20.1%$119/sqft |
Source: Public Record Report a problem | ||
| 4/13/1995 | Sold | $158,931$149/sqft |
Source: Public Record Report a problem | ||
Public tax history
Public tax history
| Year | Property taxes | Tax assessment |
|---|---|---|
| 2025 | $3,874 +2.6% | $347,201 +2% |
| 2024 | $3,777 +2.3% | $340,393 +2% |
| 2023 | $3,693 +0.3% | $333,719 +2% |
| 2022 | $3,683 +0% | $327,175 +2% |
| 2021 | $3,682 +4.3% | $320,759 +1% |
| 2020 | $3,531 -1.1% | $317,470 +2% |
| 2019 | $3,571 -2.8% | $311,245 +2% |
| 2018 | $3,676 +10.3% | $305,142 +2% |
| 2017 | $3,333 | $299,159 +2% |
| 2016 | $3,333 +2.8% | $293,293 +1.5% |
| 2015 | $3,243 +0.6% | $288,887 +2% |
| 2014 | $3,222 | $283,228 +0.5% |
| 2013 | -- | $281,948 +2% |
| 2012 | -- | $276,420 +2% |
| 2011 | -- | $271,000 +65.8% |
| 2010 | -- | $163,445 -0.2% |
| 2009 | -- | $163,833 +2% |
| 2008 | -- | $160,620 +2% |
| 2007 | -- | $157,470 +2% |
| 2006 | -- | $154,382 +2% |
| 2005 | -- | $151,355 +2% |
| 2004 | -- | $148,387 +1.9% |
| 2003 | -- | $145,667 +2% |
| 2002 | -- | $142,811 +2% |
| 2001 | -- | $140,011 +2% |
| 2000 | -- | $137,266 |
Find assessor info on the county website
BuyAbility℠ payment
Estimated monthly payment
All calculations are estimates and provided by Zillow, Inc. for informational purposes only. Actual amounts may vary.
HOA fees may include property taxes on listings classified as Co-Ops. Contact the listing agent and/or owner for fee details.
Mortgage interest rates are dependent on a number of factors, including credit score, down payment, and repayment length. Interest rate data provided by Zillow Group Marketplace, Inc. as of 1/1/1970 from various mortgage lenders with which we have lead or other similar arrangements; the Estimated Payment is an average of those rates.
See how much you could borrow to make a competitive offer.
Boost your down payment with 6% savings match
Earn up to a 6% match & get a competitive APY with a *. Zillow has partnered with to help get you home faster.
Learn more*Terms apply. Match provided by Foyer. Account offered by Pacific West Bank, Member FDIC.Climate risks
Neighborhood: 91701
Nearby schools
GreatSchools rating
- 7/10Carnelian Elementary SchoolGrades: K-6Distance: 0.5 mi
- 6/10Alta Loma Junior High SchoolGrades: 7-8Distance: 1.3 mi
- 8/10Alta Loma High SchoolGrades: 9-12Distance: 0.2 mi
- California
- San Bernardino County
- Rancho Cucamonga
- 91701
- 9038 Baseline Rd
Nearby cities
Nearby neighborhoods
Nearby zip codes
Other Rancho Cucamonga Topics
- Apartments for Rent in 91701
- Houses for Sale in 91701
- Houses for Rent in 91701
- 91701 Real Estate
- Rancho Cucamonga Condos
- Houses for Sale in Rancho Cucamonga
- Newest Listings in Rancho Cucamonga
- Rancho Cucamonga Home Values
- Rancho Cucamonga Real Estate Agents
- Rancho Cucamonga Refinance
- Rancho Cucamonga Mortgage Rates
