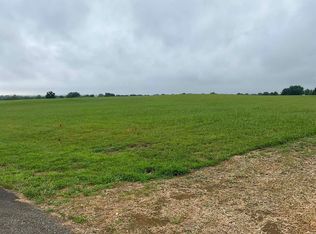
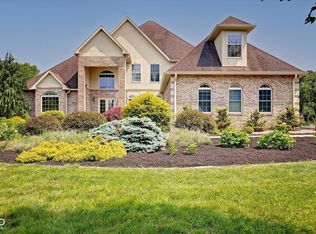
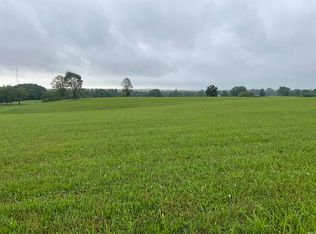
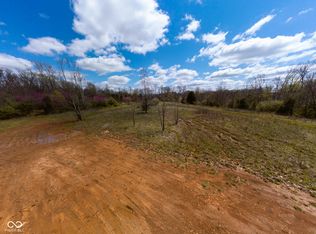
229 acres of Scenic, rolling, beautiful private land waiting for your dream build home and family compound that will allow amazing hunting and recreational opportunities in the hills and valleys just off of Lake Monroe. 2 natural springs and waterfall on the property.
Active
$3,495,000
8680 S Strain Ridge Rd, Bloomington, IN 47401
--beds
--baths
229Acres
Unimproved Land, Residential Lots
Built in ----
229 Acres Lot
$-- Zestimate®
$--/sqft
$-- HOA
What's special
Waterfall on the propertyHills and valleys
- 10 days |
- 868 |
- 10 |
Zillow last checked: 7 hours ago
Listing updated: March 24, 2026 at 09:53am
Listing Provided by:
Scott Schuler 317-703-5880,
CENTURY 21 Scheetz,
Kelly Schuler 260-591-0085,
CENTURY 21 Scheetz
Source: MIBOR as distributed by MLS GRID,MLS#: 22089755
Facts & features
Property
Lot
- Size: 229 Acres
- Features: Creek On Property, Mature Trees, On Trail, Rural, Small Trees, Water Acces, Wooded
- Topography: Bottom Land,Hilly,Pasture,Sloping,Stream,Terraced,Varied,Wooded
Details
- Additional structures: Barn(s), Equipment Shed, Tenant House, Utility Buildings(s)
- Additional parcels included: 531115300009.000006, 531116100002.006, 531116400003.000006
- Parcel number: 531116100002000006
- Zoning: Vacant Land
- Zoning description: Agricultur
- Horse amenities: None
Utilities & green energy
- Water: Municipal Water Near By, Municipal Water on Site
Community & HOA
Community
- Subdivision: No Subdivision
Location
- Region: Bloomington
Financial & listing details
- Tax assessed value: $282,200
- Annual tax amount: $1,282
- Date on market: 3/17/2026
- Cumulative days on market: 13 days
- Listing terms: Sell Entity,Will Divide
- Road surface type: Asphalt
Estimated market value
Not available
Estimated sales range
Not available
Not available
Price history
Price history
| Date | Event | Price |
|---|---|---|
| 3/17/2026 | Listed for sale | $3,495,000-5.5% |
Source: | ||
| 12/2/2025 | Listing removed | $3,699,999 |
Source: | ||
| 9/30/2025 | Price change | $3,699,999+311.1% |
Source: | ||
| 9/30/2025 | Price change | $899,999-75.7% |
Source: | ||
| 9/24/2025 | Price change | $3,699,999+8.8% |
Source: | ||
| 5/22/2025 | Pending sale | $3,399,999 |
Source: | ||
| 5/15/2025 | Price change | $3,399,999+277.8% |
Source: | ||
| 5/15/2025 | Price change | $899,999-73.5% |
Source: | ||
| 5/15/2025 | Price change | $3,399,999-5.6% |
Source: | ||
| 8/30/2024 | Price change | $3,599,999+200% |
Source: | ||
| 8/30/2024 | Price change | $1,200,000-20% |
Source: | ||
| 6/12/2024 | Price change | $1,500,000-62.5% |
Source: | ||
| 2/14/2024 | Listed for sale | $3,999,999-11.1% |
Source: | ||
| 12/12/2023 | Listing removed | $4,500,000 |
Source: | ||
| 5/11/2023 | Listed for sale | $4,500,000 |
Source: | ||
Public tax history
Public tax history
| Year | Property taxes | Tax assessment |
|---|---|---|
| 2024 | $2,553 -6.9% | $282,200 +4.3% |
| 2023 | $2,742 +19.3% | $270,600 -2.8% |
| 2022 | $2,298 -0.3% | $278,400 +17% |
| 2021 | $2,305 +25.6% | $238,000 +4.1% |
| 2020 | $1,835 -3.7% | $228,600 +6% |
| 2019 | $1,905 -3% | $215,600 -0.6% |
| 2018 | $1,964 +4.9% | $217,000 -1.8% |
| 2017 | $1,872 | $221,000 -2.1% |
| 2016 | $1,872 +0.7% | $225,800 +4.3% |
| 2014 | $1,859 +5.8% | $216,400 +3.4% |
| 2013 | $1,757 +10.3% | $209,200 +5% |
| 2012 | $1,592 -4.3% | $199,200 -6.1% |
| 2011 | $1,663 +33.5% | $212,100 +29.6% |
| 2010 | $1,246 +17.6% | $163,600 +5.7% |
| 2009 | $1,060 | $154,800 |
Find assessor info on the county website
BuyAbility℠ payment
Estimated monthly payment
All calculations are estimates and provided by Zillow, Inc. for informational purposes only. Actual amounts may vary.
HOA fees may include property taxes on listings classified as Co-Ops. Contact the listing agent and/or owner for fee details.
Mortgage interest rates are dependent on a number of factors, including credit score, down payment, and repayment length. Interest rate data provided by Zillow Group Marketplace, Inc. as of 1/1/1970 from various mortgage lenders with which we have lead or other similar arrangements; the Estimated Payment is an average of those rates.
See how much you could borrow to make a competitive offer.
Boost your down payment with 6% savings match
Earn up to a 6% match & get a competitive APY with a *. Zillow has partnered with to help get you home faster.
Learn more*Terms apply. Match provided by Foyer. Account offered by Pacific West Bank, Member FDIC.Climate risks
Neighborhood: Smithville-Sanders
Nearby schools
GreatSchools rating
- 8/10Lakeview Elementary SchoolGrades: PK-6Distance: 0.6 mi
- 8/10Jackson Creek Middle SchoolGrades: 7-8Distance: 5.7 mi
- 10/10Bloomington High School SouthGrades: 9-12Distance: 7.1 mi
Local experts in 47401

- Indiana
- Monroe County
- Bloomington
- 47401
- Smithville-Sanders
- 8680 S Strain Ridge Rd
Nearby cities
Nearby neighborhoods
Nearby zip codes
Other Bloomington Topics
