$125,400
2 bd|1 ba|-- sqft
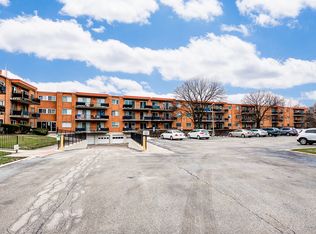
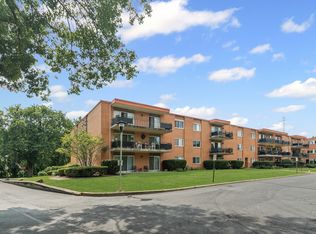
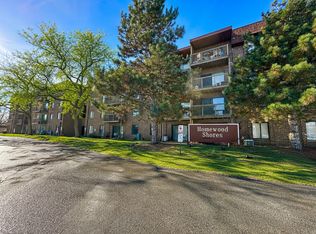
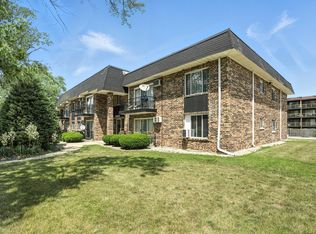
810 Elder Rd #B100, Homewood, IL 60430
Off Market
Zillow last checked: 7 hours ago
Listing updated: March 24, 2026 at 10:06pm
Jesse Valle 630-246-0114,
Smart Home Realty
Not available
Estimated sales range
Not available
Not available
| Date | Event | Price |
|---|---|---|
| 3/20/2026 | Listed for sale | $94,990-1.6%$136/sqft |
Source: | ||
| 2/27/2026 | Listing removed | $96,500$138/sqft |
Source: | ||
| 2/4/2026 | Price change | $96,500-3%$138/sqft |
Source: | ||
| 1/3/2026 | Price change | $99,500-0.5%$142/sqft |
Source: | ||
| 11/28/2025 | Price change | $99,999-1%$143/sqft |
Source: | ||
| 11/14/2025 | Price change | $100,9900%$144/sqft |
Source: | ||
| 11/7/2025 | Price change | $100,999-1%$144/sqft |
Source: | ||
| 11/1/2025 | Price change | $101,999-1%$146/sqft |
Source: | ||
| 10/24/2025 | Price change | $102,999-3.7%$147/sqft |
Source: | ||
| 10/17/2025 | Price change | $106,999-2.7%$153/sqft |
Source: | ||
| 10/8/2025 | Price change | $109,999-4.3%$157/sqft |
Source: | ||
| 9/25/2025 | Listed for sale | $114,999+219.4%$164/sqft |
Source: | ||
| 4/21/2021 | Sold | $36,000-10%$51/sqft |
Source: | ||
| 1/7/2021 | Listed for sale | $40,000$57/sqft |
Source: | ||
| 1/5/2021 | Contingent | $40,000$57/sqft |
Source: | ||
| 10/29/2020 | Pending sale | $40,000$57/sqft |
Source: Baird & Warner #10719506 Report a problem | ||
| 5/19/2020 | Listed for sale | $40,000+6.7%$57/sqft |
Source: Baird & Warner #10719506 Report a problem | ||
| 9/14/2018 | Listing removed | $37,500$54/sqft |
Source: Century 21 Affiliated #09883341 Report a problem | ||
| 5/9/2018 | Price change | $37,500-6.3%$54/sqft |
Source: CENTURY 21 Affiliated #09883341 Report a problem | ||
| 3/14/2018 | Listed for sale | $40,000-20%$57/sqft |
Source: CENTURY 21 Affiliated #09883341 Report a problem | ||
| 4/11/2005 | Sold | $50,000-7.4%$71/sqft |
Source: Public Record Report a problem | ||
| 9/28/1998 | Sold | $54,000$77/sqft |
Source: Public Record Report a problem | ||
| Year | Property taxes | Tax assessment |
|---|---|---|
| 2023 | $1,403 -27.4% | $6,590 +83% |
| 2022 | $1,932 | $3,601 |
| 2021 | -- | -- |
| 2020 | -- | -- |
| 2019 | $1,422 +3.3% | $2,833 |
| 2018 | $1,377 -26.4% | $2,833 -26.3% |
| 2017 | $1,871 -18.6% | $3,846 -16.9% |
| 2016 | $2,298 +0.9% | $4,628 |
| 2015 | $2,276 +1.9% | $4,628 |
| 2014 | $2,233 +0.5% | $4,628 -7.7% |
| 2013 | $2,221 +2.1% | $5,013 |
| 2012 | $2,176 +7.2% | $5,013 |
| 2011 | $2,029 -6.5% | $5,013 -18.1% |
| 2010 | $2,171 -1.6% | $6,118 |
| 2009 | $2,206 +6.3% | $6,118 -5% |
| 2008 | $2,075 +19.7% | $6,440 +20.7% |
| 2007 | $1,734 +1.4% | $5,334 |
| 2006 | $1,711 -1.1% | $5,334 |
| 2005 | $1,729 +2.4% | $5,334 +3.4% |
| 2004 | $1,689 +0.5% | $5,161 |
| 2003 | $1,680 +85.1% | $5,161 +11.3% |
| 2001 | $908 -2.4% | $4,639 -7.9% |
| 2000 | $930 +13.1% | $5,038 |
| 1999 | $822 | $5,038 |
Find assessor info on the county website
Source: MRED as distributed by MLS GRID. This data may not be complete. We recommend contacting the local school district to confirm school assignments for this home.