$320,100
3 bd|2 ba|1.1k sqft
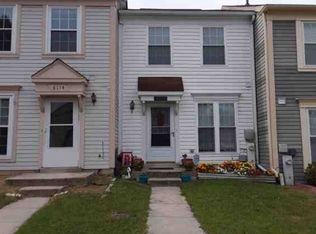
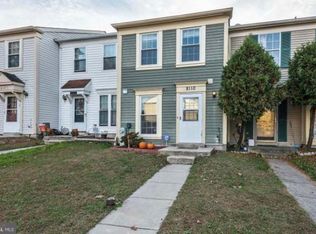
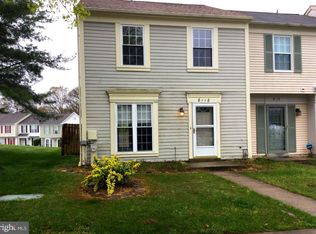
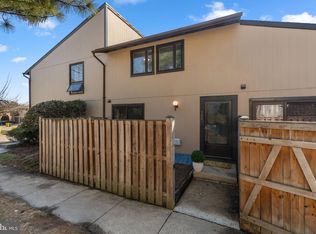
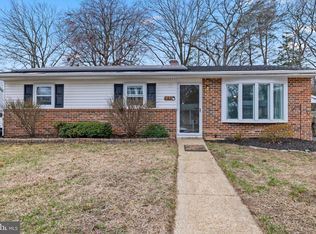
8116 Cloverhurst Rd, Glen Burnie, MD 21061
Off Market
Likely to sell faster than
Zillow last checked: 7 hours ago
Listing updated: March 25, 2026 at 09:57am
Bob Tran 301-646-1871,
ExecuHome Realty 443-757-3400
$284,600
$270,000 - $299,000
$2,125/mo
| Date | Event | Price |
|---|---|---|
| 3/25/2026 | Listed for sale | $315,000+75%$328/sqft |
Source: | ||
| 10/30/2018 | Sold | $180,000-5.2%$188/sqft |
Source: Public Record Report a problem | ||
| 8/26/2018 | Pending sale | $189,900$198/sqft |
Source: United Realty, Inc. #1001410328 Report a problem | ||
| 8/1/2018 | Price change | $189,900-4%$198/sqft |
Source: United Realty, Inc. #1001410328 Report a problem | ||
| 7/31/2018 | Price change | $197,900-1%$206/sqft |
Source: United Realty, Inc. #1001410328 Report a problem | ||
| 7/13/2018 | Price change | $199,900-1.5%$208/sqft |
Source: United Realty, Inc. #1001410328 Report a problem | ||
| 6/23/2018 | Price change | $202,900-1%$211/sqft |
Source: United Realty, Inc. #1001410328 Report a problem | ||
| 5/15/2018 | Price change | $204,900-1.4%$213/sqft |
Source: United Realty, Inc. #1001410328 Report a problem | ||
| 5/14/2018 | Price change | $207,900-1%$217/sqft |
Source: United Realty, Inc. #1001410328 Report a problem | ||
| 4/11/2018 | Listed for sale | $209,900$219/sqft |
Source: United Realty, Inc. #1001410328 Report a problem | ||
| Year | Property taxes | Tax assessment |
|---|---|---|
| 2025 | $2,846 +32.5% | $218,633 +11.4% |
| 2024 | $2,148 +2.7% | $196,200 +2.4% |
| 2023 | $2,092 +7.1% | $191,533 +2.5% |
| 2022 | $1,953 +2.6% | $186,867 +2.6% |
| 2021 | $1,904 +8.1% | $182,200 +8.2% |
| 2020 | $1,762 +8.8% | $168,433 -7.6% |
| 2019 | $1,619 +13.3% | $182,200 +29.3% |
| 2018 | $1,429 +2.3% | $140,900 +2.9% |
| 2017 | $1,396 | $136,967 +3% |
| 2016 | -- | $133,033 +3% |
| 2015 | -- | $129,100 |
| 2014 | -- | $129,100 |
| 2013 | -- | $129,100 -19.3% |
| 2012 | -- | $160,000 |
| 2011 | -- | $160,000 |
| 2010 | -- | $160,000 -24.9% |
| 2009 | -- | $212,990 +18.8% |
| 2008 | -- | $179,322 +23.1% |
| 2007 | -- | $145,656 +30.1% |
| 2006 | -- | $111,990 +10.2% |
| 2005 | -- | $101,662 +11.3% |
| 2004 | -- | $91,336 +12.7% |
| 2003 | -- | $81,010 +0.9% |
| 2002 | -- | $80,312 +0.9% |
| 2001 | -- | $79,616 |
Find assessor info on the county website
Source: Bright MLS. This data may not be complete. We recommend contacting the local school district to confirm school assignments for this home.