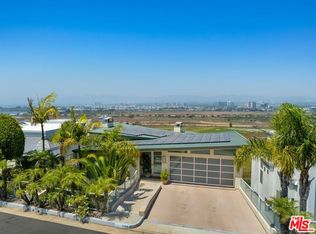
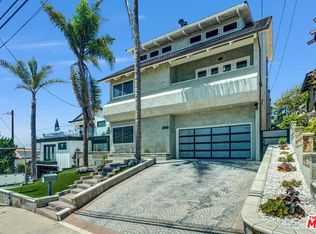
This 7500 square foot single family home has 5 bedrooms and 5.0 bathrooms. This home is located at 7805 Veragua Dr, Playa Del Rey, CA 90293.
Foreclosed
Est. $3,447,500
7805 Veragua Dr, Playa Del Rey, CA 90293
5beds
5baths
7,500sqft
SingleFamily
Built in 1989
5,227 Square Feet Lot
$3,447,500 Zestimate®
$460/sqft
$-- HOA
Overview
- 330 days |
- 86 |
- 1 |
Facts & features
Interior
Bedrooms & bathrooms
- Bedrooms: 5
- Bathrooms: 5
Heating
- Forced air
Cooling
- Other
Appliances
- Included: Dishwasher, Dryer, Washer
- Laundry: In Unit
Features
- Flooring: Hardwood
- Has fireplace: Yes
- Furnished: Yes
Interior area
- Total interior livable area: 7,500 sqft
Property
Parking
- Total spaces: 2
- Parking features: Garage - Detached, Off-street
Features
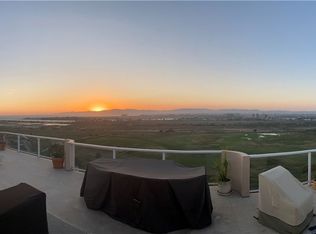
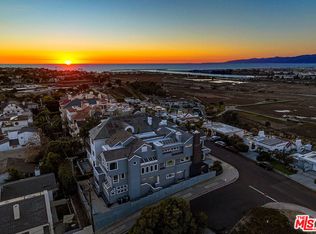
- Has view: Yes
- View description: Water, City
- Has water view: Yes
- Water view: Water
Lot
- Size: 5,227 Square Feet
Details
- Parcel number: 4114001005
Construction
Type & style
- Home type: SingleFamily
Condition
- Year built: 1989
Community & HOA
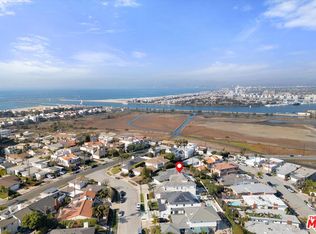
Location
- Region: Playa Del Rey
Financial & listing details
- Price per square foot: $460/sqft
- Tax assessed value: $2,105,143
- Annual tax amount: $25,631
Visit our professional directory to find a foreclosure specialist in your area that can help with your home search.
Find a foreclosure agentForeclosure details
Estimated market value
$3,447,500
$2.93M - $4.00M
$30,000/mo
Price history
Price history
| Date | Event | Price |
|---|---|---|
| 3/26/2025 | Sold | $2,880,735+37.2%$384/sqft |
Source: Public Record Report a problem | ||
| 3/14/2024 | Listing removed | -- |
Source: CRMLS #SR24008600 Report a problem | ||
| 1/30/2024 | Listed for rent | $17,000-2.9%$2/sqft |
Source: CRMLS #SR24008600 Report a problem | ||
| 1/26/2024 | Listing removed | -- |
Source: Zillow Rentals Report a problem | ||
| 11/10/2023 | Price change | $17,500-2.8%$2/sqft |
Source: Zillow Rentals Report a problem | ||
| 5/26/2023 | Price change | $18,000+12.5%$2/sqft |
Source: Zillow Rentals Report a problem | ||
| 11/3/2022 | Price change | $16,000+12.3%$2/sqft |
Source: Zillow Rental Manager Report a problem | ||
| 10/28/2022 | Price change | $14,250-20.8%$2/sqft |
Source: Zillow Rental Manager Report a problem | ||
| 9/26/2022 | Listed for rent | $18,000+5.9%$2/sqft |
Source: Zillow Rental Manager Report a problem | ||
| 3/14/2021 | Listing removed | -- |
Source: Zillow Rental Manager Report a problem | ||
| 1/1/2021 | Price change | $16,995-14.6%$2/sqft |
Source: CRISNet / SRAR #SR19277585 Report a problem | ||
| 5/5/2020 | Price change | $19,900+10.6%$3/sqft |
Source: Brixton Gate Realty, Inc #SR19277585 Report a problem | ||
| 4/5/2020 | Price change | $18,000-28%$2/sqft |
Source: Brixton Gate Realty, Inc #SR19277585 Report a problem | ||
| 12/9/2019 | Listed for rent | $25,000$3/sqft |
Source: Brixton Gate Realty, Inc #SR19277585 Report a problem | ||
| 10/18/2019 | Listing removed | $25,000$3/sqft |
Source: Inzio Property Management & Leasing, Inc Report a problem | ||
| 8/16/2019 | Price change | $25,000+13.6%$3/sqft |
Source: Inzio Property Management & Leasing, Inc Report a problem | ||
| 1/21/2019 | Price change | $22,000-12%$3/sqft |
Source: Capital Investment Realty Grp. #18413464 Report a problem | ||
| 5/24/2018 | Listed for rent | $25,000$3/sqft |
Source: Inzio Property Management & Leasing #18347530 Report a problem | ||
| 6/18/2011 | Listing removed | $2,100,000$280/sqft |
Source: Standard Home Realty #F11050170 Report a problem | ||
| 4/22/2011 | Listed for sale | $2,100,000+47.4%$280/sqft |
Source: Standard Home Realty #F11050170 Report a problem | ||
| 7/27/2001 | Sold | $1,425,000+50%$190/sqft |
Source: Public Record Report a problem | ||
| 9/20/1996 | Sold | $950,000$127/sqft |
Source: Public Record Report a problem | ||
Public tax history
Public tax history
| Year | Property taxes | Tax assessment |
|---|---|---|
| 2025 | $25,631 +1.3% | $2,105,143 +2% |
| 2024 | $25,307 +2% | $2,063,867 +2% |
| 2023 | $24,820 +4.9% | $2,023,400 +2% |
| 2022 | $23,667 +1% | $1,983,727 +2% |
| 2021 | $23,429 -1% | $1,944,831 +1% |
| 2020 | $23,667 | $1,924,890 +2% |
| 2019 | $23,667 +4.7% | $1,887,148 +2% |
| 2018 | $22,599 | $1,850,146 +2% |
| 2017 | $22,599 +2.2% | $1,813,870 +2% |
| 2016 | $22,110 +2.5% | $1,778,305 +1.5% |
| 2015 | $21,562 +1.2% | $1,751,594 +2% |
| 2014 | $21,308 | $1,717,283 +2.5% |
| 2012 | -- | $1,676,004 +2% |
| 2011 | -- | $1,643,143 +0.8% |
| 2010 | -- | $1,630,863 -0.2% |
| 2009 | -- | $1,634,738 +2% |
| 2008 | -- | $1,602,685 +2% |
| 2007 | -- | $1,571,260 +2% |
| 2006 | -- | $1,540,452 |
| 2005 | -- | $1,540,452 +4% |
| 2004 | -- | $1,480,636 +1.9% |
| 2003 | -- | $1,453,500 +2% |
| 2002 | -- | $1,425,000 +28.1% |
| 2000 | -- | $1,112,659 |
Find assessor info on the county website
BuyAbility℠ payment
Estimated monthly payment
Boost your down payment with 6% savings match
Earn up to a 6% match & get a competitive APY with a *. Zillow has partnered with to help get you home faster.
Learn more*Terms apply. Match provided by Foyer. Account offered by Pacific West Bank, Member FDIC.Climate risks
Neighborhood: Playa Del Rey
Nearby schools
GreatSchools rating
- 6/10Paseo Del Rey Natural Science MagnetGrades: K-5Distance: 0.6 mi
- 4/10Katherine Johnson STEM AcademyGrades: 6-8Distance: 0.6 mi
- 6/10Westchester Enriched Sciences Magnet Health/Sports MedicineGrades: 9-12Distance: 0.6 mi
- Loading
