This 1120 square foot single family home has 3 bedrooms and 1.0 bathrooms. This home is located at 755 Rees Ct, Longmont, CO 80504.
Pre-foreclosure
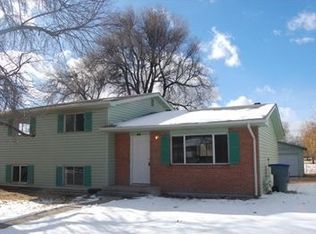
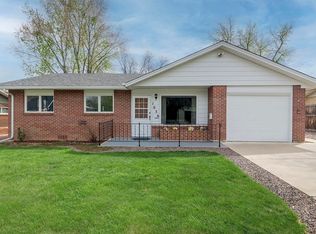
Street View
Est. $387,900
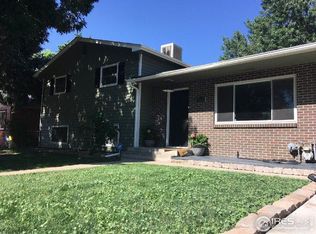
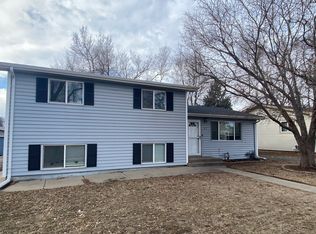
755 Rees Ct, Longmont, CO 80504
3beds
1baths
1,120sqft
SingleFamily
Built in 1966
8,886 Square Feet Lot
$387,900 Zestimate®
$346/sqft
$-- HOA
Overview
- 283 days |
- 30 |
- 0 |
Facts & features
Interior
Bedrooms & bathrooms
- Bedrooms: 3
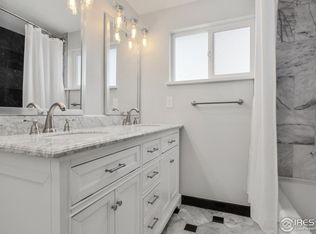
- Bathrooms: 1
Heating
- Forced air
Interior area
- Total interior livable area: 1,120 sqft
Property
Parking
- Parking features: Carport, Garage
Features
- Exterior features: Shingle, Wood
Lot
- Size: 8,886 Square Feet
Details
- Parcel number: 131502207005
Construction
Type & style
- Home type: SingleFamily
Materials
- Frame
Condition
- Year built: 1966
Community & HOA
Location
- Region: Longmont
Financial & listing details
- Price per square foot: $346/sqft
- Tax assessed value: $377,400
- Annual tax amount: $2,037
Visit our professional directory to find a foreclosure specialist in your area that can help with your home search.
Find a foreclosure agentForeclosure details
Estimated market value
$387,900
$353,000 - $419,000
$2,163/mo
Price history
Price history
| Date | Event | Price |
|---|---|---|
| 6/18/1997 | Sold | $96,000$86/sqft |
Source: Public Record Report a problem | ||
Public tax history
Public tax history
| Year | Property taxes | Tax assessment |
|---|---|---|
| 2025 | $2,037 +1.4% | $23,588 -5.6% |
| 2024 | $2,009 +5.2% | $24,977 -1% |
| 2023 | $1,909 -1.3% | $25,220 +30.7% |
| 2022 | $1,934 +18.9% | $19,293 -2.8% |
| 2021 | $1,627 | $19,848 +18.5% |
| 2020 | $1,627 +14.4% | $16,746 |
| 2019 | $1,422 | $16,746 +11.9% |
| 2018 | $1,422 | $14,969 -9.5% |
| 2017 | $1,422 +19.4% | $16,549 +32.8% |
| 2016 | $1,191 +4.9% | $12,457 +35.6% |
| 2015 | $1,135 +32.2% | $9,186 |
| 2014 | $858 -19.3% | $9,186 |
| 2013 | $1,063 +6.8% | $9,186 -19.9% |
| 2012 | $996 -0.1% | $11,463 |
| 2011 | $997 +1.8% | -- |
| 2010 | $979 -15.9% | $11,580 |
| 2009 | $1,164 +12.1% | $11,580 -27.4% |
| 2008 | $1,038 +10.1% | $15,940 |
| 2007 | $943 -1.8% | $15,940 +10.5% |
| 2006 | $960 -1.3% | $14,430 |
| 2005 | $972 +1.2% | $14,430 -1.8% |
| 2004 | $961 +1.4% | $14,700 |
| 2003 | $948 +10.5% | $14,700 +17.5% |
| 2002 | $858 | $12,510 -90.8% |
| 2001 | -- | $136,700 |
Find assessor info on the county website
Monthly payment
Estimated monthly payment
All calculations are estimates and provided by Zillow, Inc. for informational purposes only. Actual amounts may vary.
HOA fees may include property taxes on listings classified as Co-Ops. Contact the listing agent and/or owner for fee details.
Mortgage interest rates are dependent on a number of factors, including credit score, down payment, and repayment length. Interest rate data provided by Zillow Group Marketplace, Inc. as of 1/1/1970 from various mortgage lenders with which we have lead or other similar arrangements; the Estimated Payment is an average of those rates.
See how much you could borrow to make a competitive offer.
Climate risks
Neighborhood: Kensington
Nearby schools
GreatSchools rating
- 5/10Columbine Elementary SchoolGrades: PK-5Distance: 0.3 mi
- 4/10Trail Ridge Middle SchoolGrades: 6-8Distance: 1.7 mi
- 3/10Skyline High SchoolGrades: 9-12Distance: 0.9 mi


Nearby cities
Nearby neighborhoods
Nearby zip codes
Other Longmont Topics
