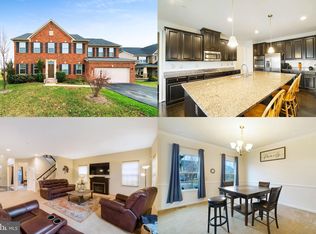
$644,600
-- bd|2 ba|3.4k sqft
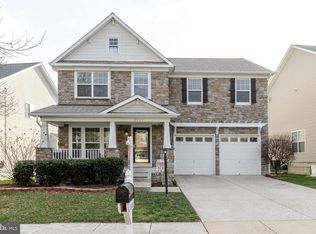
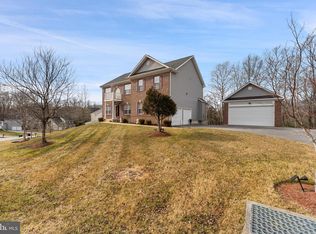
7304 Sudley Ave, Brandywine, MD 20613
Off Market
Zillow last checked: 8 hours ago
Listing updated: February 01, 2026 at 04:11am
Chris PERRY 301-254-5411,
Compass (202) 386-6330
Not available
Estimated sales range
Not available
$4,166/mo
| Date | Event | Price |
|---|---|---|
| 2/1/2026 | Listed for sale | $649,000$214/sqft |
Source: | ||
| 1/1/2026 | Listing removed | $649,000$214/sqft |
Source: | ||
| 9/5/2025 | Price change | $649,000-1.7%$214/sqft |
Source: | ||
| 6/4/2025 | Listed for sale | $659,990+27.9%$217/sqft |
Source: | ||
| 6/16/2021 | Sold | $516,000$170/sqft |
Source: Public Record Report a problem | ||
| 12/17/2020 | Sold | $516,000+0.2%$170/sqft |
Source: Agent Provided Report a problem | ||
| 8/22/2020 | Pending sale | $515,000$170/sqft |
Source: Samson Properties #MDPG576942 Report a problem | ||
| 8/19/2020 | Listed for sale | $515,000$170/sqft |
Source: Samson Properties #MDPG576942 Report a problem | ||
| 8/11/2020 | Pending sale | $515,000$170/sqft |
Source: Samson Properties #MDPG576942 Report a problem | ||
| 8/7/2020 | Price change | $515,000-1.9%$170/sqft |
Source: Samson Properties #MDPG576942 Report a problem | ||
| 5/22/2020 | Price change | $525,000-1.9%$173/sqft |
Source: Bennett Realty Solutions #MDPG564842 Report a problem | ||
| 4/15/2020 | Price change | $535,000-2.7%$176/sqft |
Source: Bennett Realty Solutions #MDPG564842 Report a problem | ||
| 4/8/2020 | Listed for sale | $550,000$181/sqft |
Source: Bennett Realty Solutions #MDPG564842 Report a problem | ||
| Year | Property taxes | Tax assessment |
|---|---|---|
| 2025 | $9,290 +54.5% | $598,300 +10.6% |
| 2024 | $6,014 +11.9% | $540,800 +11.9% |
| 2023 | $5,374 +13.5% | $483,300 +13.5% |
| 2022 | $4,735 +3% | $425,800 +3% |
| 2021 | $4,596 +3.1% | $413,300 +3.1% |
| 2020 | $4,457 -21.9% | $400,800 +4.3% |
| 2019 | $5,708 | $384,100 |
| 2018 | $5,708 +1.1% | $384,100 +1.1% |
| 2017 | $5,645 +0.8% | $379,900 +1.1% |
| 2016 | $5,603 | $375,700 +0.8% |
| 2015 | $5,603 | $372,900 +0.8% |
| 2014 | $5,603 | $370,100 +0.8% |
| 2013 | -- | $367,300 |
| 2012 | -- | $367,300 |
| 2011 | -- | $367,300 -11.1% |
| 2010 | -- | $413,260 +876.3% |
| 2009 | -- | $42,330 +5% |
| 2008 | -- | $40,330 |
Find assessor info on the county website
Source: Bright MLS. This data may not be complete. We recommend contacting the local school district to confirm school assignments for this home.