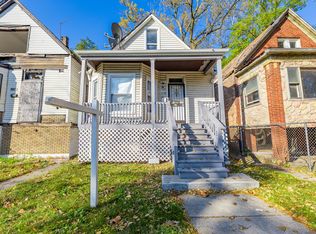
This 882 square foot single family home has 2 bedrooms and 1.0 bathrooms. This home is located at 7246 S Green St, Chicago, IL 60621.
Foreclosed
Est. $112,300
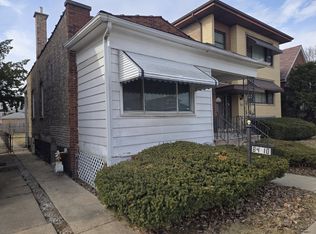
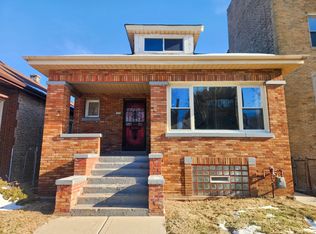
7246 S Green St, Chicago, IL 60621
2beds
1baths
882sqft
SingleFamily
Built in 1922
3,125 Square Feet Lot
$112,300 Zestimate®
$127/sqft
$-- HOA
Overview
- 677 days |
- 5 |
- 1 |
Facts & features
Interior
Bedrooms & bathrooms
- Bedrooms: 2
- Bathrooms: 1
Cooling
- None
Interior area
- Total interior livable area: 882 sqft
Property
Parking
- Parking features: Garage - Attached
Features
- Exterior features: Other
Lot
- Size: 3,125 Square Feet
Details
- Parcel number: 2029214052
Construction
Type & style
- Home type: SingleFamily
Materials
- Foundation: Slab
- Roof: Shake / Shingle
Condition
- Year built: 1922
Community & HOA
Location
- Region: Chicago
Financial & listing details
- Price per square foot: $127/sqft
- Tax assessed value: $39,990
- Annual tax amount: $844
Visit our professional directory to find a foreclosure specialist in your area that can help with your home search.
Find a foreclosure agentForeclosure details
Estimated market value
$112,300
$75,000 - $156,000
$1,334/mo
Price history
Price history
Price history is unavailable.
Public tax history
Public tax history
| Year | Property taxes | Tax assessment |
|---|---|---|
| 2023 | $844 +2.6% | $3,999 |
| 2022 | $823 +2.3% | $3,999 |
| 2021 | $804 -36.4% | $3,999 -29.5% |
| 2020 | $1,264 -0.2% | $5,673 -10% |
| 2019 | $1,267 +1.7% | $6,304 |
| 2018 | $1,245 -20.2% | $6,304 -13.1% |
| 2017 | $1,561 +7.5% | $7,253 |
| 2016 | $1,453 +187.6% | $7,253 |
| 2015 | $505 -60.2% | $7,253 +6.1% |
| 2014 | $1,268 +199.7% | $6,834 |
| 2013 | $423 -65.5% | $6,834 |
| 2012 | $1,226 +1057% | $6,834 -31.1% |
| 2011 | $106 -93.4% | $9,921 |
| 2010 | $1,614 +269.8% | $9,921 |
| 2009 | $437 +7.8% | $9,921 -2.3% |
| 2008 | $405 +135.5% | $10,156 |
| 2007 | $172 -5.8% | $10,156 |
| 2006 | $183 -69.9% | $10,156 +36% |
| 2005 | $606 +144.6% | $7,465 |
| 2004 | $248 -22.1% | $7,465 |
| 2003 | $318 -65.8% | $7,465 +44.4% |
| 2002 | $929 +70.5% | $5,171 |
| 2001 | $545 +42.7% | $5,171 |
| 2000 | $382 +2.7% | $5,171 +29.7% |
| 1999 | $372 | $3,987 |
Find assessor info on the county website
BuyAbility℠ payment
Estimated monthly payment
Boost your down payment with 6% savings match
Earn up to a 6% match & get a competitive APY with a *. Zillow has partnered with to help get you home faster.
Learn more*Terms apply. Match provided by Foyer. Account offered by Pacific West Bank, Member FDIC.Climate risks
Neighborhood: Englewood
Nearby schools
GreatSchools rating
- 3/10Stagg Elementary SchoolGrades: PK-8Distance: 0.3 mi
- NAEXCEL ACADEMY - ENGLEWOOD HSGrades: 9-12Distance: 0.2 mi