$1,357,500
5 bd|3 ba|2.1k sqft
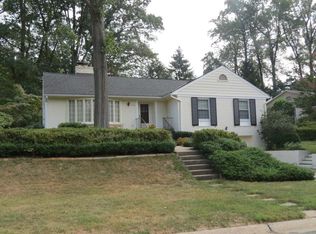
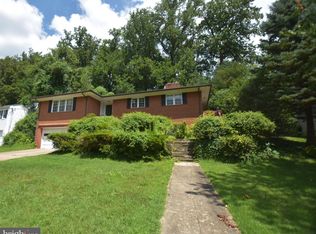
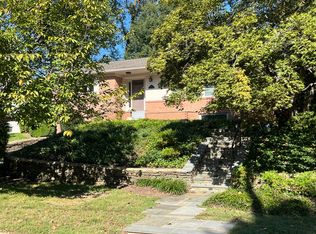
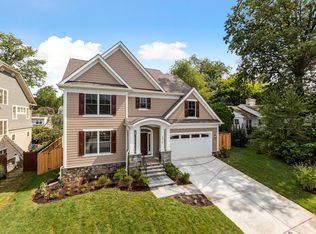
6817 Millwood Rd, Bethesda, MD 20817
Off Market
Zillow last checked: 8 hours ago
Listing updated: February 11, 2026 at 07:54am
Daniel Kotz 703-489-3123,
Serhant 5403797359
$2,761,200
$2.62M - $2.90M
$7,053/mo
| Date | Event | Price |
|---|---|---|
| 12/17/2025 | Listing removed | $2,999,000$483/sqft |
Source: | ||
| 11/28/2025 | Price change | $2,999,000-9.1%$483/sqft |
Source: | ||
| 11/18/2025 | Price change | $3,299,000-2.9%$531/sqft |
Source: | ||
| 9/12/2025 | Listed for sale | $3,399,000-9.4%$547/sqft |
Source: | ||
| 6/30/2025 | Listing removed | $3,750,000$603/sqft |
Source: | ||
| 5/2/2025 | Listed for sale | $3,750,000+72.4%$603/sqft |
Source: | ||
| 10/23/2020 | Sold | $2,175,000-1.1%$350/sqft |
Source: Public Record Report a problem | ||
| 7/28/2020 | Pending sale | $2,199,000$354/sqft |
Source: Washington Fine Properties, LLC #MDMC710382 Report a problem | ||
| 7/24/2020 | Price change | $2,199,000-2.3%$354/sqft |
Source: Washington Fine Properties, LLC #MDMC710382 Report a problem | ||
| 6/11/2020 | Listed for sale | $2,250,000+17.5%$362/sqft |
Source: Washington Fine Properties, LLC #MDMC710382 Report a problem | ||
| 1/1/2015 | Sold | $1,915,000$308/sqft |
Source: | ||
| 4/22/2014 | Sold | $1,915,000-1.5%$308/sqft |
Source: Public Record Report a problem | ||
| 3/20/2014 | Pending sale | $1,945,000$313/sqft |
Source: Long & Foster Real Estate #MC8292505 Report a problem | ||
| 3/15/2014 | Listed for sale | $1,945,000+166.4%$313/sqft |
Source: Long & Foster Real Estate #MC8292505 Report a problem | ||
| 5/21/2013 | Sold | $730,000$117/sqft |
Source: Public Record Report a problem | ||
| Year | Property taxes | Tax assessment |
|---|---|---|
| 2025 | $27,112 +8.1% | $2,277,667 +4.5% |
| 2024 | $25,080 +2.2% | $2,178,600 +2.3% |
| 2023 | $24,534 +6.9% | $2,129,300 +2.4% |
| 2022 | $22,953 +2.5% | $2,080,000 +2.4% |
| 2021 | $22,388 -0.1% | $2,030,700 |
| 2020 | $22,403 -4.6% | $2,030,700 -4.6% |
| 2019 | $23,484 -0.2% | $2,129,700 |
| 2018 | $23,527 +3.1% | $2,129,700 +5.2% |
| 2017 | $22,823 +188.5% | $2,023,567 +5.5% |
| 2016 | $7,912 | $1,917,433 +230.3% |
| 2015 | $7,912 | $580,500 +15% |
| 2014 | $7,912 | $504,900 -30.3% |
| 2013 | -- | $724,300 +3.9% |
| 2012 | -- | $697,400 |
| 2011 | -- | $697,400 |
| 2010 | -- | $697,400 -13.2% |
| 2009 | -- | $803,350 +5.6% |
| 2008 | -- | $760,772 +5.9% |
| 2007 | -- | $718,196 +6.3% |
| 2006 | -- | $675,620 +12.2% |
| 2005 | -- | $602,102 +13.9% |
| 2004 | -- | $528,586 +16.2% |
| 2003 | -- | $455,070 +9.2% |
| 2002 | -- | $416,790 |
| 2001 | -- | $416,790 |
Find assessor info on the county website
Source: Bright MLS. This data may not be complete. We recommend contacting the local school district to confirm school assignments for this home.