This property will be sold through the applicable foreclosure auction process. The property is being sold 'as is' and the occupancy status is assumed to be occupied. The buyer assumes all responsibility for the property condition and occupancy.
Auction

Est. $670,300
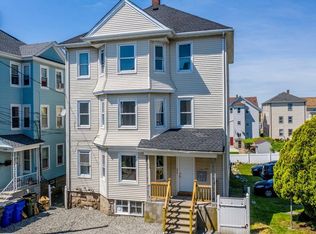
646 Birch St, Fall River, MA 02724
9beds
2,619sqft
Multi Family
Built in 1900
-- sqft lot
$670,300 Zestimate®
$--/sqft
$-- HOA
Overview
- 41 days |
- 243 |
- 9 |
Zillow last checked: March 14, 2026 at 12:14am
Source: Xome
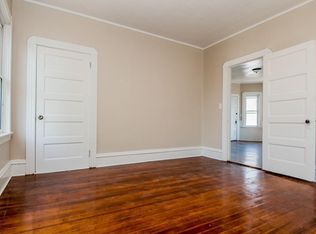
Facts & features
Interior
Bedrooms & bathrooms
- Bedrooms: 9
- Bathrooms: 3
- Full bathrooms: 3
Features
- Has basement: No
Interior area
- Total structure area: 2,619
- Total interior livable area: 2,619 sqft
Property
Lot
- Size: 3,920.4 Square Feet
Details
- Parcel number: FALLM0B11B0000L0053
- Special conditions: Auction
Construction
Type & style
- Home type: MultiFamily
- Property subtype: Multi Family
Condition
- Year built: 1900
Community & HOA
Location
- Region: Fall River
Financial & listing details
- Tax assessed value: $505,100
- Annual tax amount: $5,783
- Date on market: 2/1/2026
- Lease term: Contact For Details
This listing is brought to you by Xome
View Auction DetailsEstimated market value
$670,300
$637,000 - $704,000
$2,092/mo
Public tax history
Public tax history
| Year | Property taxes | Tax assessment |
|---|---|---|
| 2025 | $5,783 +24.2% | $505,100 +24.7% |
| 2024 | $4,655 +11.1% | $405,100 +18.6% |
| 2023 | $4,190 +12.8% | $341,500 +16% |
| 2022 | $3,715 +10.9% | $294,400 +21.5% |
| 2021 | $3,351 +10.6% | $242,300 +15.6% |
| 2020 | $3,029 +15.7% | $209,600 +16.7% |
| 2019 | $2,619 +6.8% | $179,600 +7% |
| 2018 | $2,453 +3.4% | $167,800 -0.9% |
| 2017 | $2,372 +2.1% | $169,400 -0.6% |
| 2016 | $2,323 +6.2% | $170,400 +1.9% |
| 2015 | $2,188 -3.3% | $167,300 -7% |
| 2014 | $2,263 +3.5% | $179,900 -1.8% |
| 2013 | $2,186 +6.5% | $183,200 -2% |
| 2012 | $2,053 +5.4% | $187,000 -13.2% |
| 2010 | $1,948 -5.8% | $215,500 -16% |
| 2009 | $2,068 -6% | $256,600 -10.5% |
| 2008 | $2,199 +7.9% | $286,700 +1% |
| 2007 | $2,038 +12.7% | $283,800 +7.2% |
| 2006 | $1,809 -0.1% | $264,800 +11.4% |
| 2005 | $1,810 +29.8% | $237,800 +40% |
| 2004 | $1,394 +9.7% | $169,800 +43% |
| 2003 | $1,271 +8.8% | $118,700 |
| 2002 | $1,168 | $118,700 |
Find assessor info on the county website
Climate risks
Neighborhood: Sandy Beach
Nearby schools
GreatSchools rating
- 4/10Carlton M. Viveiros Elementary SchoolGrades: K-5Distance: 0.1 mi
- 2/10Matthew J Kuss Middle SchoolGrades: 6-8Distance: 0.6 mi
- 2/10B M C Durfee High SchoolGrades: 9-12Distance: 3.1 mi