$181,700
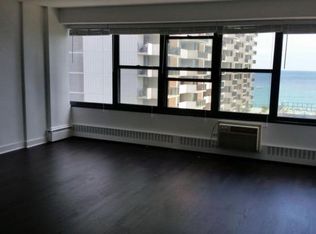
1 bd|1 ba|800 sqft
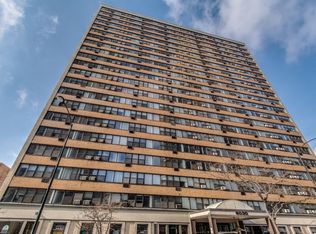
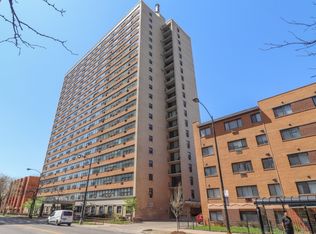
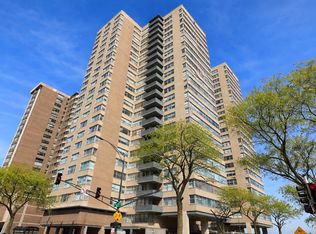
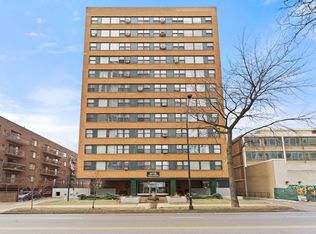
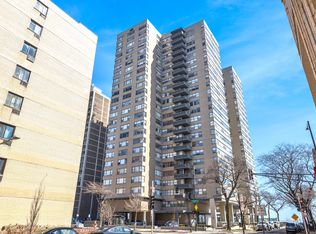
6030 N Sheridan Rd APT 102, Chicago, IL 60660
Off Market
Likely to sell faster than
Zillow last checked: 7 hours ago
Listing updated: March 24, 2026 at 02:58pm
Cristina Dusa cristina@fultongrace.com,
Fulton Grace Realty
$176,000
$167,000 - $185,000
$1,771/mo
| Date | Event | Price |
|---|---|---|
| 3/23/2026 | Listed for sale | $175,000+45.8%$219/sqft |
Source: | ||
| 7/3/2020 | Listing removed | $120,000$150/sqft |
Source: RE/MAX Next #10729973 Report a problem | ||
| 7/3/2020 | Listed for sale | $120,000+4.3%$150/sqft |
Source: RE/MAX Next #10729973 Report a problem | ||
| 6/30/2020 | Sold | $115,000-4.2%$144/sqft |
Source: | ||
| 6/5/2020 | Pending sale | $120,000$150/sqft |
Source: RE/MAX Next #10729973 Report a problem | ||
| 5/30/2020 | Listed for sale | $120,000+0.1%$150/sqft |
Source: RE/MAX Next #10729973 Report a problem | ||
| 12/23/2019 | Listing removed | $119,900$150/sqft |
Source: Keller Williams Chicago-OHare #10427727 Report a problem | ||
| 6/24/2019 | Listed for sale | $119,900-4%$150/sqft |
Source: Keller Williams Chicago-OHare #10427727 Report a problem | ||
| 11/30/2014 | Listing removed | $1,200$2/sqft |
Source: Chicago Apartment finders Report a problem | ||
| 10/30/2014 | Listed for rent | $1,200$2/sqft |
Source: Chicago Apartment Finders Report a problem | ||
| 9/28/2008 | Listing removed | $124,900$156/sqft |
Source: Listhub #06690042 Report a problem | ||
| 6/10/2008 | Listed for sale | $124,900-16.7%$156/sqft |
Source: Listhub #06690042 Report a problem | ||
| 4/14/2005 | Sold | $150,000$188/sqft |
Source: Public Record Report a problem | ||
| Year | Property taxes | Tax assessment |
|---|---|---|
| 2023 | $2,160 +2.6% | $10,239 |
| 2022 | $2,106 +2.3% | $10,239 |
| 2021 | $2,059 +35.1% | $10,239 +49.7% |
| 2020 | $1,524 +0.2% | $6,840 -9.6% |
| 2019 | $1,521 +1.7% | $7,569 |
| 2018 | $1,495 +53.4% | $7,569 +67.2% |
| 2017 | $975 +7.5% | $4,527 |
| 2016 | $907 +9.3% | $4,527 |
| 2015 | $830 -8.9% | $4,527 -7.8% |
| 2014 | $911 +2% | $4,908 |
| 2013 | $893 -14.4% | $4,908 -15.5% |
| 2012 | $1,042 -21.5% | $5,809 -29.1% |
| 2011 | $1,327 -0.4% | $8,191 |
| 2010 | $1,333 -8.7% | $8,191 -12.5% |
| 2009 | $1,460 -24.7% | $9,361 -30.7% |
| 2008 | $1,938 +1% | $13,507 |
| 2007 | $1,918 -1.1% | $13,507 |
| 2006 | $1,939 +26.8% | $13,507 +44.4% |
| 2005 | $1,529 +234.4% | $9,355 +231% |
| 2004 | $457 +3% | $2,826 +0.7% |
| 2003 | $444 | $2,806 |
Find assessor info on the county website
Source: MRED as distributed by MLS GRID. This data may not be complete. We recommend contacting the local school district to confirm school assignments for this home.