This 1812 square foot single family home has 2 bedrooms and 2.0 bathrooms. This home is located at 5890 NE 21st Rd, Fort Lauderdale, FL 33308.
Pre-foreclosure
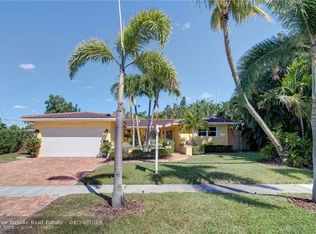
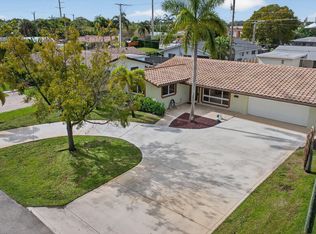
Street View
Est. $618,700
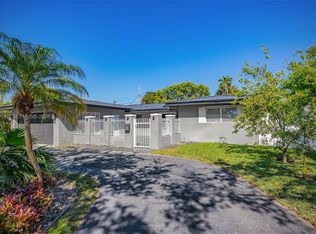
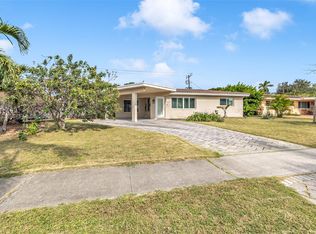
5890 NE 21st Rd, Fort Lauderdale, FL 33308
2beds
2baths
1,812sqft
SingleFamily
Built in 1963
7,498 Square Feet Lot
$618,700 Zestimate®
$341/sqft
$263/mo HOA
Overview
- 188 days |
- 38 |
- 3 |
Facts & features
Interior
Bedrooms & bathrooms
- Bedrooms: 2
- Bathrooms: 2
Features
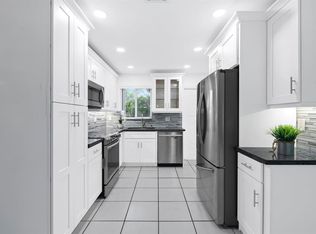
- Flooring: Tile, Concrete
Interior area
- Total interior livable area: 1,812 sqft
Property
Features
- Exterior features: Stucco, Cement / Concrete
Lot
- Size: 7,498 Square Feet
Details
- Parcel number: 494212071270
Construction
Type & style
- Home type: SingleFamily
Materials
- masonry
- Foundation: Other
- Roof: Tile
Condition
- Year built: 1963
Community & HOA
HOA
- Has HOA: Yes
- HOA fee: $263 monthly
Location
- Region: Fort Lauderdale
Financial & listing details
- Price per square foot: $341/sqft
- Tax assessed value: $711,420
- Annual tax amount: $4,814
Visit our professional directory to find a foreclosure specialist in your area that can help with your home search.
Find a foreclosure agentForeclosure details
Estimated market value
$618,700
$557,000 - $687,000
$5,796/mo
Price history
Price history
| Date | Event | Price |
|---|---|---|
| 4/27/1999 | Sold | $180,000+33.3%$99/sqft |
Source: Public Record Report a problem | ||
| 6/29/1993 | Sold | $135,000$75/sqft |
Source: Public Record Report a problem | ||
Public tax history
Public tax history
| Year | Property taxes | Tax assessment |
|---|---|---|
| 2024 | $4,814 +2.5% | $265,600 +3% |
| 2023 | $4,699 +5.7% | $257,870 +3% |
| 2022 | $4,444 +3.1% | $250,360 +3% |
| 2021 | $4,312 +1.9% | $243,070 +1.4% |
| 2020 | $4,232 +8.4% | $239,720 +2.3% |
| 2019 | $3,905 | $234,340 +1.9% |
| 2018 | $3,905 +6% | $229,980 +2.1% |
| 2017 | $3,684 +0.7% | $225,250 +2.1% |
| 2016 | $3,657 -0.6% | $220,620 +0.7% |
| 2015 | $3,679 -2% | $219,090 +0.8% |
| 2014 | $3,754 | $217,360 -8.6% |
| 2013 | $3,754 +5.5% | $237,790 +4% |
| 2012 | $3,558 +3.9% | $228,700 +3.1% |
| 2011 | $3,423 -0.3% | $221,910 +10.2% |
| 2010 | $3,434 -4.2% | $201,430 -6% |
| 2009 | $3,584 -30.3% | $214,310 -27.3% |
| 2008 | $5,145 -11.8% | $294,630 -6.3% |
| 2007 | $5,834 -7.3% | $314,550 +2.5% |
| 2006 | $6,293 | $306,880 +7.2% |
| 2005 | -- | $286,270 +20.7% |
| 2004 | $5,950 +15.8% | $237,090 +14.1% |
| 2003 | $5,138 +10.8% | $207,730 +13.3% |
| 2002 | $4,638 +24.5% | $183,380 +24.6% |
| 2001 | $3,725 +5.4% | $147,130 |
| 2000 | $3,534 | -- |
Find assessor info on the county website
BuyAbility℠ payment
Estimated monthly payment
Boost your down payment with 6% savings match
Earn up to a 6% match & get a competitive APY with a *. Zillow has partnered with to help get you home faster.
Learn more*Terms apply. Match provided by Foyer. Account offered by Pacific West Bank, Member FDIC.Climate risks
Neighborhood: Imperial Point
Nearby schools
GreatSchools rating
- 7/10McNab Elementary SchoolGrades: PK-5Distance: 0.9 mi
- 5/10Pompano Beach Middle SchoolGrades: 6-8Distance: 2.5 mi
- 2/10Northeast High SchoolGrades: 9-12Distance: 1.5 mi