$136,400
2 bd|1 ba|1k sqft
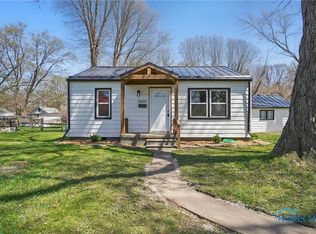
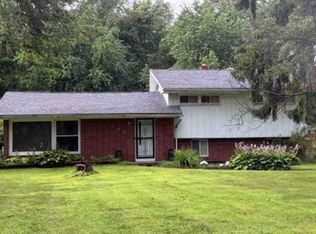
5611 Pawnee Rd, Toledo, OH 43613
Off Market
Zillow last checked: 7 hours ago
Listing updated: 15 hours ago
Jody Broyles 419-343-1166,
Key Realty
$161,000
$143,000 - $177,000
$1,569/mo
| Date | Event | Price |
|---|---|---|
| 6/14/2019 | Sold | $85,000+146.4%$53/sqft |
Source: Public Record Report a problem | ||
| 7/22/2015 | Listing removed | $900$1/sqft |
Source: D3L Properties of Ohio LLC Report a problem | ||
| 7/19/2015 | Listed for rent | $900$1/sqft |
Source: D3L Properties of Ohio LLC Report a problem | ||
| 7/7/2015 | Sold | $34,500-10.8%$22/sqft |
Source: Public Record Report a problem | ||
| 4/22/2015 | Sold | $38,667+286.7%$24/sqft |
Source: Public Record Report a problem | ||
| 4/11/2015 | Price change | $10,000-87.5%$6/sqft |
Source: Auction.com Report a problem | ||
| 3/31/2015 | Listed for sale | -- |
Source: Auction.com Report a problem | ||
| 7/2/2010 | Sold | $80,000+142.4%$50/sqft |
Source: Public Record Report a problem | ||
| 3/31/2010 | Sold | $33,000-17.3%$21/sqft |
Source: Public Record Report a problem | ||
| 3/7/2010 | Price change | $39,900-13.1%$25/sqft |
Source: foreclosure.com Report a problem | ||
| 2/7/2010 | Price change | $45,900-11.5%$29/sqft |
Source: foreclosure.com Report a problem | ||
| 1/7/2010 | Price change | $51,850-13.6%$33/sqft |
Source: foreclosure.com Report a problem | ||
| 12/17/2009 | Listed for sale | -- |
Source: foreclosure.com Report a problem | ||
| 12/11/2009 | Sold | $60,000-31.4%$38/sqft |
Source: Public Record Report a problem | ||
| 12/5/2006 | Sold | $87,500$55/sqft |
Source: Public Record Report a problem | ||
| Year | Property taxes | Tax assessment |
|---|---|---|
| 2024 | $2,793 +3.9% | $41,545 +21.9% |
| 2023 | $2,687 +1.4% | $34,090 |
| 2022 | $2,649 -2.9% | $34,090 |
| 2021 | $2,729 -0.5% | $34,090 +17.8% |
| 2020 | $2,743 +104.3% | $28,945 |
| 2019 | $1,342 -48.5% | $28,945 |
| 2018 | $2,604 +9.5% | $28,945 +9.2% |
| 2017 | $2,379 +0.5% | $26,495 -65% |
| 2016 | $2,368 -2.2% | $75,700 |
| 2015 | $2,422 +34.1% | $75,700 +185.7% |
| 2014 | $1,805 | $26,500 |
| 2013 | $1,805 +3.8% | $26,500 |
| 2012 | $1,739 -10.6% | $26,500 -5.4% |
| 2011 | $1,946 -5.5% | $28,010 |
| 2010 | $2,059 -25.9% | $28,010 -28.7% |
| 2009 | $2,779 +10.2% | $39,310 -13% |
| 2008 | $2,523 +10.2% | $45,190 |
| 2007 | $2,290 -1.6% | $45,190 |
| 2006 | $2,328 +31.6% | $45,190 +15.8% |
| 2004 | $1,769 +8.4% | $39,030 |
| 2003 | $1,632 -16.5% | $39,030 +20.9% |
| 2002 | $1,954 +31.6% | $32,280 |
| 2001 | $1,485 -49.2% | $32,280 |
| 2000 | $2,925 | $32,280 |
Find assessor info on the county website
Source: NORIS. This data may not be complete. We recommend contacting the local school district to confirm school assignments for this home.