This is a 2361 square foot, single family home. This home is located at 56 Orton Rd, West Caldwell, NJ 07006.
Foreclosed
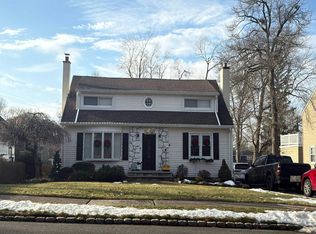
Street View
Est. $818,000
56 Orton Rd, West Caldwell, NJ 07006
--beds
--baths
2,361sqft
SingleFamily
Built in 1793
0.74 Acres Lot
$818,000 Zestimate®
$346/sqft
$-- HOA
Overview
- 86 days |
- 32 |
- 0 |
Facts & features
Interior
Interior area
- Total interior livable area: 2,361 sqft
Property
Lot
- Size: 0.74 Acres
Details
- Parcel number: 2102903000000010
Construction
Type & style
- Home type: SingleFamily
Condition
- Year built: 1793
Community & HOA
Location
- Region: West Caldwell
Financial & listing details
- Price per square foot: $346/sqft
- Tax assessed value: $489,500
- Annual tax amount: $13,393
Visit our professional directory to find a foreclosure specialist in your area that can help with your home search.
Find a foreclosure agentForeclosure details
Estimated market value
$818,000
$728,000 - $908,000
$4,271/mo
Price history
Price history
| Date | Event | Price |
|---|---|---|
| 1/29/2024 | Listing removed | -- |
Source: | ||
| 5/30/2023 | Pending sale | $550,000$233/sqft |
Source: | ||
| 5/23/2023 | Listed for sale | $550,000$233/sqft |
Source: | ||
Public tax history
Public tax history
| Year | Property taxes | Tax assessment |
|---|---|---|
| 2025 | $13,393 | $489,500 |
| 2024 | $13,393 +2.9% | $489,500 |
| 2023 | $13,011 +0.8% | $489,500 |
| 2022 | $12,913 +1% | $489,500 |
| 2021 | $12,786 +1.2% | $489,500 |
| 2020 | $12,629 +35.1% | $489,500 |
| 2019 | $9,346 | $489,500 |
| 2018 | $9,346 -19.2% | $489,500 |
| 2017 | $11,567 +1.2% | $489,500 |
| 2016 | $11,425 +1.3% | $489,500 |
| 2015 | $11,283 +2.1% | $489,500 |
| 2014 | $11,048 +2.9% | $489,500 |
| 2013 | $10,740 +0.2% | $489,500 |
| 2012 | $10,720 -1.8% | $489,500 |
| 2011 | $10,912 +4.4% | $489,500 +88.6% |
| 2010 | $10,450 +5.9% | $259,500 |
| 2009 | $9,866 +4.7% | $259,500 |
| 2008 | $9,420 +3.7% | $259,500 |
| 2007 | $9,083 | $259,500 |
| 2006 | -- | $259,500 |
| 2005 | -- | $259,500 |
| 2004 | $8,615 | $259,500 |
| 2003 | -- | $259,500 |
| 2002 | -- | $259,500 |
| 2001 | -- | $259,500 |
Find assessor info on the county website
BuyAbility℠ payment
Estimated monthly payment
Boost your down payment with 6% savings match
Earn up to a 6% match & get a competitive APY with a *. Zillow has partnered with to help get you home faster.
Learn more*Terms apply. Match provided by Foyer. Account offered by Pacific West Bank, Member FDIC.Climate risks
Neighborhood: 07006
Nearby schools
GreatSchools rating
- 6/10Wilson Elementary SchoolGrades: K-5Distance: 0.1 mi
- 6/10Grover Cleveland Middle SchoolGrades: 6-8Distance: 0.9 mi
- 6/10James Caldwell High SchoolGrades: 9-12Distance: 0.4 mi