$1,143,400
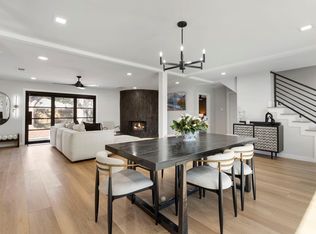
5 bd|4 ba|4.3k sqft
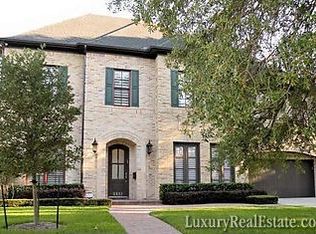
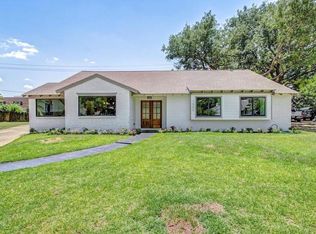
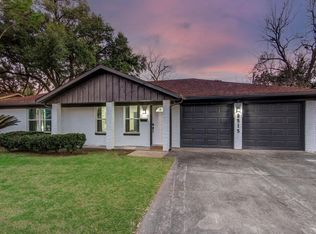
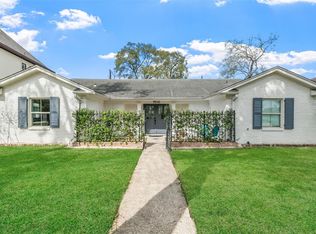
5543 Edith St, Houston, TX 77081
Off Market
Likely to sell faster than
Zillow last checked: 7 hours ago
Listing updated: March 18, 2026 at 02:04am
Meshi Slama TREC #0800878 979-422-0895,
Nextgen Real Estate Properties
$649,500
$617,000 - $682,000
$2,567/mo
| Date | Event | Price |
|---|---|---|
| 3/17/2026 | Listed for sale | $680,000+18.3%$321/sqft |
Source: | ||
| 3/3/2026 | Listing removed | $9,750$5/sqft |
Source: Zillow Rentals Report a problem | ||
| 11/21/2024 | Listed for rent | $9,750$5/sqft |
Source: Zillow Rentals Report a problem | ||
| 11/6/2024 | Listing removed | $9,750$5/sqft |
Source: Zillow Rentals Report a problem | ||
| 9/6/2024 | Listed for rent | $9,750$5/sqft |
Source: Zillow Rentals Report a problem | ||
| 8/28/2024 | Listing removed | $9,750$5/sqft |
Source: Zillow Rentals Report a problem | ||
| 1/3/2024 | Listed for rent | $9,750$5/sqft |
Source: Zillow Rentals Report a problem | ||
| 10/18/2023 | Listing removed | -- |
Source: | ||
| 8/25/2023 | Listed for sale | $575,000+1.1%$272/sqft |
Source: | ||
| 8/22/2023 | Listing removed | -- |
Source: | ||
| 8/3/2023 | Price change | $569,000-2.7%$269/sqft |
Source: | ||
| 7/13/2023 | Price change | $585,000-2.3%$276/sqft |
Source: | ||
| 7/6/2023 | Listed for sale | $599,000+93.2%$283/sqft |
Source: | ||
| 11/5/2022 | Listing removed | -- |
Source: | ||
| 10/28/2022 | Pending sale | $310,000$147/sqft |
Source: | ||
| 10/3/2022 | Price change | $310,000-3.1%$147/sqft |
Source: | ||
| 9/26/2022 | Listed for sale | $320,000$151/sqft |
Source: | ||
| Year | Property taxes | Tax assessment |
|---|---|---|
| 2025 | -- | $489,502 -3.3% |
| 2024 | $10,587 +54.3% | $505,983 +48.6% |
| 2023 | $6,862 +329.1% | $340,601 +0.5% |
| 2022 | $1,599 | $338,777 +3.6% |
| 2021 | -- | $326,967 +2.3% |
| 2020 | $2,120 -8.3% | $319,501 +0.6% |
| 2019 | $2,312 +28% | $317,706 +2% |
| 2018 | $1,806 | $311,359 |
| 2017 | $1,806 +15.1% | $311,359 |
| 2016 | $1,569 | $311,359 +15.7% |
| 2015 | -- | $269,174 +32.2% |
| 2014 | -- | $203,636 +10.9% |
| 2013 | -- | $183,582 -4.4% |
| 2012 | -- | $191,944 -12% |
| 2011 | -- | $218,096 |
| 2010 | -- | $218,096 |
| 2009 | -- | $218,096 -4.4% |
| 2007 | -- | $228,159 +21.3% |
| 2006 | -- | $188,100 +10% |
| 2005 | -- | $171,000 +3.1% |
| 2004 | -- | $165,900 +3.6% |
| 2003 | -- | $160,200 +10% |
| 2002 | -- | $145,700 +10% |
| 2001 | -- | $132,500 |
| 2000 | -- | $132,500 |
Find assessor info on the county website
Source: HAR. This data may not be complete. We recommend contacting the local school district to confirm school assignments for this home.