$193,800
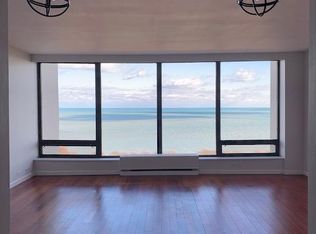
1 bd|1 ba|850 sqft
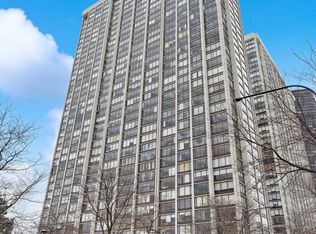
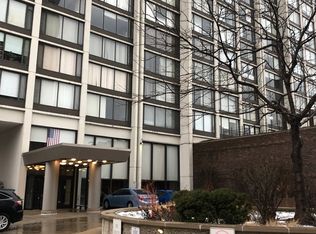
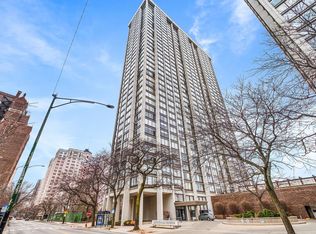
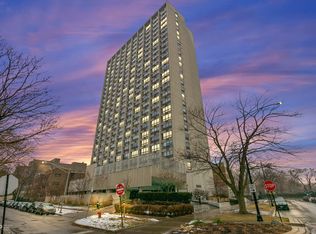
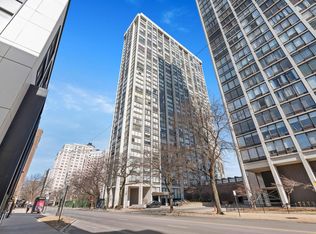
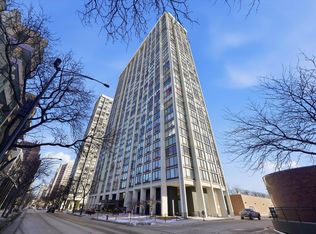
5455 N Sheridan Rd APT 1203, Chicago, IL 60640
Off Market
Likely to sell faster than
Zillow last checked: 7 hours ago
Listing updated: March 13, 2026 at 10:07pm
Lumi Boldovici 312-532-4688,
Lumi Boldovici LLC
Not available
Estimated sales range
Not available
Not available
| Date | Event | Price |
|---|---|---|
| 3/9/2026 | Listed for sale | $209,900+39.9%$250/sqft |
Source: | ||
| 5/2/2016 | Sold | $150,000-6.2%$179/sqft |
Source: | ||
| 3/23/2016 | Pending sale | $159,900$190/sqft |
Source: @properties #09134862 Report a problem | ||
| 3/16/2016 | Listed for sale | $159,900$190/sqft |
Source: @properties #09134862 Report a problem | ||
| 2/23/2016 | Pending sale | $159,900$190/sqft |
Source: @properties #09134862 Report a problem | ||
| 2/9/2016 | Listed for sale | $159,900-12.4%$190/sqft |
Source: @properties #09134862 Report a problem | ||
| 5/28/2009 | Sold | $182,500-5.7%$217/sqft |
Source: | ||
| 3/17/2009 | Price change | $193,500-2.5%$230/sqft |
Source: NRT Chicago #07053696 Report a problem | ||
| 10/25/2008 | Listed for sale | $198,500+41.8%$236/sqft |
Source: NRT Chicago #07053696 Report a problem | ||
| 4/9/2001 | Sold | $140,000+64.7%$167/sqft |
Source: Public Record Report a problem | ||
| 11/5/1998 | Sold | $85,000+39.3%$101/sqft |
Source: Public Record Report a problem | ||
| 4/2/1997 | Sold | $61,000$73/sqft |
Source: Public Record Report a problem | ||
| Year | Property taxes | Tax assessment |
|---|---|---|
| 2023 | $2,465 +3.5% | $14,999 |
| 2022 | $2,382 +1.5% | $14,999 |
| 2021 | $2,346 -5.5% | $14,999 +5.2% |
| 2020 | $2,484 +0.2% | $14,253 -9.6% |
| 2019 | $2,480 +1.8% | $15,771 |
| 2018 | $2,437 +32.8% | $15,771 +32.5% |
| 2017 | $1,835 -23% | $11,900 |
| 2016 | $2,383 +75.7% | $11,900 |
| 2015 | $1,357 +23.5% | $11,900 +15.3% |
| 2014 | $1,099 +3.8% | $10,324 |
| 2013 | $1,058 -2.5% | $10,324 |
| 2012 | $1,085 -40.9% | $10,324 -29.8% |
| 2011 | $1,836 -3.3% | $14,697 |
| 2010 | $1,898 -17.2% | $14,697 |
| 2009 | $2,292 +67.4% | $14,697 -9.6% |
| 2008 | $1,369 +34.2% | $16,258 |
| 2007 | $1,020 +0.8% | $16,258 |
| 2006 | $1,012 -5.5% | $16,258 +17.2% |
| 2005 | $1,071 -52.3% | $13,873 |
| 2004 | $2,244 +2.2% | $13,873 |
| 2003 | $2,195 +58.3% | $13,873 +79.7% |
| 2002 | $1,387 +3.7% | $7,721 |
| 2001 | $1,337 +23.2% | $7,721 |
| 2000 | $1,085 -0.7% | $7,721 +36.7% |
| 1999 | $1,093 | $5,650 |
Find assessor info on the county website
Source: MRED as distributed by MLS GRID. This data may not be complete. We recommend contacting the local school district to confirm school assignments for this home.