Tenant has been maintaining the home
Pending
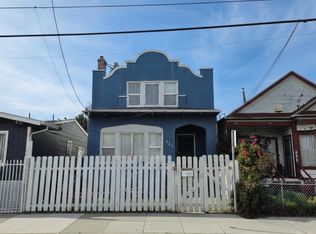
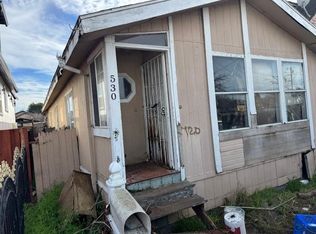
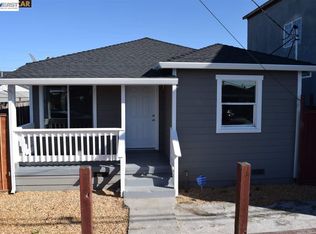
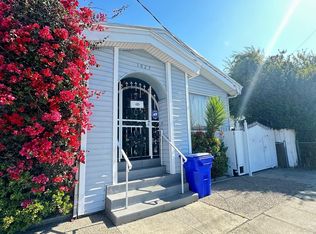
Street View
$385,000
545 3rd St, Richmond, CA 94801
4beds
1,483sqft
Est.:
Single Family Residence
Built in 1914
2,613.6 Square Feet Lot
$386,100 Zestimate®
$260/sqft
$-- HOA
What's special
- 119 days |
- 36 |
- 0 |
Zillow last checked: 7 hours ago
Listing updated: December 02, 2025 at 11:18am
Listed by:
Fred Valverde DRE #00713558 925-408-9060,
FRED VALVERDE, BROKER
Source: bridgeMLS/CCAR/Bay East AOR,MLS#: 41117920
Facts & features
Interior
Bedrooms & bathrooms
- Bedrooms: 4
- Bathrooms: 1
- Full bathrooms: 1
Rooms
- Room types: No Additional Rooms
Kitchen
- Features: Other
Heating
- Other
Cooling
- None
Appliances
- Laundry: Other
Features
- Flooring: Other
- Has fireplace: No
- Fireplace features: None
Interior area
- Total structure area: 1,483
- Total interior livable area: 1,483 sqft
Property
Parking
- Parking features: Off Street
Features
- Levels: One Story
- Stories: 1
- Exterior features: Other
- Pool features: None
Lot
- Size: 2,613.6 Square Feet
- Features: Level
Details
- Parcel number: 5342710315
- Special conditions: Offer As Is
- Other equipment: Other
Construction
Type & style
- Home type: SingleFamily
- Architectural style: Bungalow
- Property subtype: Single Family Residence
Materials
- Other
Condition
- Existing
- New construction: No
- Year built: 1914
Utilities & green energy
- Electric: No Solar
Community & HOA
HOA
- Has HOA: No
Location
- Region: Richmond
Financial & listing details
- Price per square foot: $260/sqft
- Tax assessed value: $198,060
- Annual tax amount: $5,226
- Date on market: 11/20/2025
- Listing terms: Cash
Estimated market value
$386,100
$347,000 - $429,000
$3,129/mo
Price history
Price history
| Date | Event | Price |
|---|---|---|
| 12/2/2025 | Pending sale | $385,000$260/sqft |
Source: | ||
| 11/20/2025 | Listed for sale | $385,000-16.3%$260/sqft |
Source: | ||
| 10/2/2025 | Listing removed | $460,000$310/sqft |
Source: | ||
| 7/30/2025 | Listed for sale | $460,000+1.1%$310/sqft |
Source: | ||
| 7/30/2025 | Listing removed | $455,000$307/sqft |
Source: | ||
| 5/27/2025 | Listed for sale | $455,000-1.1%$307/sqft |
Source: | ||
| 5/23/2025 | Listing removed | $460,000$310/sqft |
Source: | ||
| 2/12/2025 | Listed for sale | $460,000+1050%$310/sqft |
Source: | ||
| 5/13/2009 | Sold | $40,000-15.8%$27/sqft |
Source: Public Record Report a problem | ||
| 3/15/2009 | Listed for sale | $47,500-50.9%$32/sqft |
Source: foreclosure.com Report a problem | ||
| 2/3/2009 | Sold | $96,800-74.9%$65/sqft |
Source: Public Record Report a problem | ||
| 11/22/2005 | Sold | $385,000+61.8%$260/sqft |
Source: Public Record Report a problem | ||
| 6/15/2004 | Sold | $238,000$160/sqft |
Source: Public Record Report a problem | ||
Public tax history
Public tax history
| Year | Property taxes | Tax assessment |
|---|---|---|
| 2025 | $5,226 -6.1% | $198,060 +2% |
| 2024 | $5,563 +17.9% | $194,177 -0.6% |
| 2023 | $4,716 -10.3% | $195,420 +2% |
| 2022 | $5,257 +6.6% | $191,590 +2% |
| 2021 | $4,930 +5.8% | $187,834 +1% |
| 2020 | $4,658 +2.4% | $185,909 +2% |
| 2019 | $4,548 +3.6% | $182,264 +2% |
| 2018 | $4,389 +78.5% | $178,691 +302.7% |
| 2017 | $2,458 +2.8% | $44,377 +2% |
| 2016 | $2,393 +4.8% | $43,508 +1.5% |
| 2015 | $2,283 | $42,855 +2% |
| 2014 | $2,283 | $42,017 +0.5% |
| 2013 | -- | $41,828 +2% |
| 2012 | -- | $41,008 +2% |
| 2011 | -- | $40,204 +0.8% |
| 2010 | -- | $39,904 -0.2% |
| 2009 | -- | $40,000 -87.4% |
| 2008 | -- | $318,000 -19% |
| 2007 | -- | $392,700 +2% |
| 2006 | -- | $385,000 +58.6% |
| 2005 | -- | $242,760 +1502.7% |
| 2004 | -- | $15,147 +1.9% |
| 2003 | -- | $14,870 +2% |
| 2002 | -- | $14,579 +2% |
| 2001 | -- | $14,294 |
Find assessor info on the county website
BuyAbility℠ payment
Est. payment
$2,275/mo
Principal & interest
$1906
Property taxes
$369
More affordability tools
Climate risks
Neighborhood: Iron Triangle
Nearby schools
GreatSchools rating
- 1/10Peres Elementary SchoolGrades: K-8Distance: 0.3 mi
- 3/10Richmond High SchoolGrades: 9-12Distance: 1.5 mi
- 1/10Helms Middle SchoolGrades: 7-8Distance: 2.2 mi
Local experts in 94801
Nearby cities
Nearby neighborhoods
Nearby zip codes
Other Richmond Topics
