$759,000
3 bd|2 ba|1.9k sqft
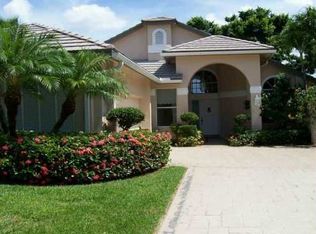
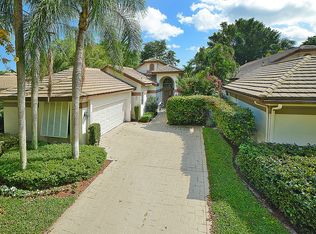
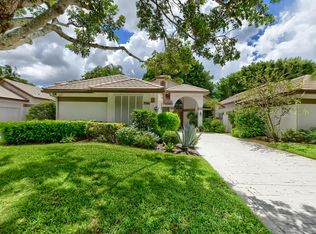
5360 NW 20th Ave, Boca Raton, FL 33496
Sold
$1,353,700
$1.29M - $1.42M
$5,110/mo
List your home for rent
$5,110/mo
Rent Zestimate®
Find your next renter with Zillow Rental Manager. Plus, with online applications, you can quickly screen prospective tenants – for free.
Learn more$5,110/mo
Rent Zestimate®
Refinance and save
$9,893/mo
Est. payment
Refinancing to a lower rate could help reduce your monthly payments and save thousands over the life of the loan.
See today's rates$9,893/mo
Est. payment
Work with a Zillow partner agent
Leverage their expertise and Zillow's premium Showcase listings to get your home seen by more buyers.
Get startedList with your own agent
Get your home in front of millions of buyers by listing it on Zillow.
Learn how to do itSell it yourself
Take full control of how buyers see your home on Zillow by listing For Sale by Owner (FSBO).
List your homeZillow last checked: 7 hours ago
Listing updated: March 30, 2026 at 07:51am
Susan Demerer 561-213-6347,
Compass Florida LLC
Robyn Dana Rosen, 3286614
Compass Florida LLC
Robyn Dana Rosen, 3286614
Compass Florida LLC
| Date | Event | Price |
|---|---|---|
| 3/30/2026 | Sold | $1,350,000+99.3%$772/sqft |
Source: | ||
| 12/7/2022 | Sold | $677,500+47.3%$388/sqft |
Source: | ||
| 7/13/2022 | Sold | $460,000-7.5%$263/sqft |
Source: | ||
| 6/21/2022 | Pending sale | $497,500+87.7%$285/sqft |
Source: | ||
| 12/10/2010 | Sold | $265,000-11.4%$152/sqft |
Source: Public Record Report a problem | ||
| Year | Property taxes | Tax assessment |
|---|---|---|
| 2024 | $11,139 +2.3% | $672,113 +3% |
| 2023 | $10,893 +227% | $652,537 +202.7% |
| 2022 | $3,331 +1.2% | $215,542 +3% |
Find assessor info on the county website