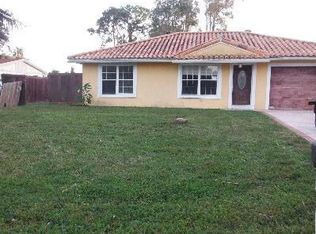
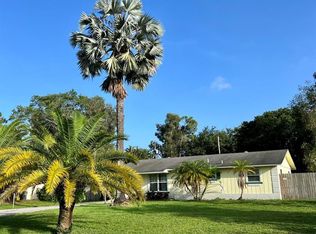
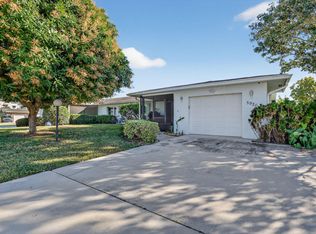
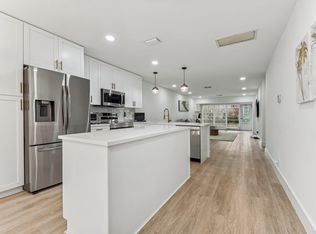
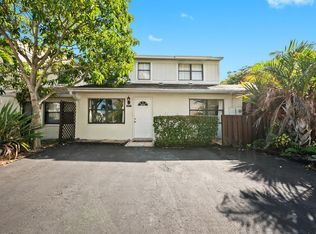
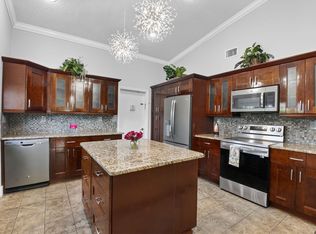
NO HOA! Needs some TLC. 3BR/1BA Delray Beach home is just 5 miles to the beach and 4 miles to Downtown Delray. Enjoy true Florida living with a large fenced backyard--perfect for entertaining, pets, or adding a pool. Bright, open living spaces and endless potential make this the perfect starter home, Airbnb, or investment property. Freedom, location, and lifestyle all in one--no HOA, no restrictions! Live minutes from Atlantic Ave, shopping, dining, and the sand. Addotional room/laundry room with a door to backyard. No laundry hook ups , can be added
Pre-foreclosure
Est. $430,633
5196 Palm Ridge Blvd, Delray Beach, FL 33484
3beds
1,641sqft
Single Family Residence
Built in 1975
-- sqft lot
$-- Zestimate®
$262/sqft
$-- HOA
Overview
- 126 days |
- 116 |
- 7 |
Zillow last checked:
Source: Illustrated Properties,MLS#: R11134041
Facts & features
Interior
Bedrooms & bathrooms
- Bedrooms: 3
- Bathrooms: 1
- Full bathrooms: 1
Features
- Has basement: No
Interior area
- Total structure area: 1,641
- Total interior livable area: 1,641 sqft
Property
Details
- Parcel number: 00424611020001240
Construction
Type & style
- Home type: SingleFamily
- Property subtype: Single Family Residence
Condition
- Year built: 1975
Community & HOA
Location
- Region: Delray Beach
Financial & listing details
- Price per square foot: $262/sqft
- Tax assessed value: $430,633
- Annual tax amount: $7,458
- Date on market: 10/21/2025
- Lease term: Contact For Details
Visit our professional directory to find a foreclosure specialist in your area that can help with your home search.
Find a foreclosure agentForeclosure details
Estimated market value
Not available
Estimated sales range
Not available
$2,929/mo
Price history
| Date | Event | Price |
|---|---|---|
| 2/6/2026 | Listing removed | $485,000$296/sqft |
Source: Illustrated Properties #R11134041 Report a problem | ||
| 11/18/2025 | Price change | $485,000-1%$296/sqft |
Source: | ||
| 10/21/2025 | Listed for sale | $490,000+92.2%$299/sqft |
Source: | ||
| 4/21/2019 | Listing removed | $255,000$155/sqft |
Source: Atlantic Florida Properties #RX-10477250 Report a problem | ||
| 11/5/2018 | Price change | $255,000-3.8%$155/sqft |
Source: Atlantic Florida Properties #RX-10477250 Report a problem | ||
| 11/1/2018 | Listed for sale | $265,000+154.8%$161/sqft |
Source: Atlantic Florida Properties #RX-10477250 Report a problem | ||
| 2/10/2012 | Listing removed | $103,999$63/sqft |
Source: Rising Realty #R3165560 Report a problem | ||
| 2/9/2011 | Listed for sale | $103,999-64.7%$63/sqft |
Source: Engel & Volkers Jupiter Real Estate #R3165560 Report a problem | ||
| 12/27/2005 | Sold | $295,000+63.9%$180/sqft |
Source: Public Record Report a problem | ||
| 5/25/2004 | Sold | $180,000+105.7%$110/sqft |
Source: Public Record Report a problem | ||
| 10/14/2003 | Sold | $87,500+30.6%$53/sqft |
Source: Public Record Report a problem | ||
| 6/11/2002 | Sold | $67,000+21.8%$41/sqft |
Source: Public Record Report a problem | ||
| 12/10/1998 | Sold | $55,000+17%$34/sqft |
Source: Public Record Report a problem | ||
| 1/9/1998 | Sold | $47,000$29/sqft |
Source: Public Record Report a problem | ||
Public tax history
| Year | Property taxes | Tax assessment |
|---|---|---|
| 2024 | $7,458 +94.3% | $430,633 +74% |
| 2023 | $3,838 +1.1% | $247,491 +3% |
| 2022 | $3,796 +1% | $240,283 +3% |
| 2021 | $3,759 -6% | $233,284 +1.4% |
| 2020 | $3,998 -5.4% | $230,063 +18.2% |
| 2019 | $4,227 | $194,624 +10% |
| 2018 | $4,227 +14% | $176,931 -1.9% |
| 2017 | $3,709 -2.3% | $180,435 +77.7% |
| 2016 | $3,796 +118.4% | $101,515 +0.7% |
| 2015 | $1,738 -1.6% | $100,809 +0.8% |
| 2014 | $1,765 +1.8% | $100,009 +1.5% |
| 2013 | $1,734 +1% | $98,531 +1.7% |
| 2012 | $1,716 -14% | $96,884 -11.6% |
| 2011 | $1,995 -14.9% | $109,552 -13.9% |
| 2010 | $2,344 -3% | $127,272 -14.9% |
| 2009 | $2,415 -40.1% | $149,592 -26.7% |
| 2008 | $4,031 -4.1% | $204,210 -6.7% |
| 2007 | $4,204 -12.5% | $218,833 -5.5% |
| 2006 | $4,802 | $231,680 +45.8% |
| 2005 | -- | $158,910 +19.2% |
| 2004 | $1,383 +514.4% | $133,267 +13.9% |
| 2003 | $225 -89.4% | $117,045 +20.3% |
| 2002 | $2,132 +10.5% | $97,331 +13.1% |
| 2001 | $1,930 +15.7% | $86,071 +16.2% |
| 2000 | $1,668 +25.3% | $74,046 +8.5% |
| 1999 | $1,331 | $68,230 |
Find assessor info on the county website
Monthly payment
Estimated monthly payment
All calculations are estimates and provided by Zillow, Inc. for informational purposes only. Actual amounts may vary.
HOA fees may include property taxes on listings classified as Co-Ops. Contact the listing agent and/or owner for fee details.
Mortgage interest rates are dependent on a number of factors, including credit score, down payment, and repayment length. Interest rate data provided by Zillow Group Marketplace, Inc. as of 1/1/1970 from various mortgage lenders with which we have lead or other similar arrangements; the Estimated Payment is an average of those rates.
See how much you could borrow to make a competitive offer.
Climate risks
Neighborhood: 33484
Nearby schools
GreatSchools rating
- 8/10Banyan Creek Elementary SchoolGrades: PK-5Distance: 0.8 mi
- 3/10Carver Middle SchoolGrades: 6-8Distance: 1.5 mi
- 5/10Atlantic High SchoolGrades: 9-12Distance: 2.1 mi

- Florida
- Palm Beach County
- Delray Beach
- 33484
- 5196 Palm Ridge Blvd
Nearby cities
Nearby neighborhoods
Nearby zip codes
Other Delray Beach Topics
