This 1800 square foot single family home has 4 bedrooms and 3.0 bathrooms. This home is located at 51 Pinyon St, Howell, NJ 07731.
Pre-foreclosure
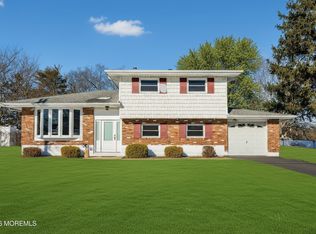
Street View
Est. $704,300
51 Pinyon St, Howell, NJ 07731
4beds
3baths
1,800sqft
SingleFamily
Built in 1987
10,210 Square Feet Lot
$704,300 Zestimate®
$391/sqft
$-- HOA
Overview
- 77 days |
- 8 |
- 0 |
Facts & features
Interior
Bedrooms & bathrooms
- Bedrooms: 4
- Bathrooms: 3
Interior area
- Total interior livable area: 1,800 sqft
Property
Lot
- Size: 10,210 Square Feet
Details
- Parcel number: 2100002000000115
Construction
Type & style
- Home type: SingleFamily
- Architectural style: Colonial
Condition
- Year built: 1987
Community & HOA
Location
- Region: Howell
Financial & listing details
- Price per square foot: $391/sqft
- Tax assessed value: $610,200
- Annual tax amount: $10,441
Visit our professional directory to find a foreclosure specialist in your area that can help with your home search.
Find a foreclosure agentForeclosure details
Estimated market value
$704,300
$662,000 - $747,000
$3,744/mo
Price history
Price history
| Date | Event | Price |
|---|---|---|
| 11/22/2019 | Sold | $387,000$215/sqft |
Source: Public Record Report a problem | ||
Public tax history
Public tax history
| Year | Property taxes | Tax assessment |
|---|---|---|
| 2025 | $10,441 +8.9% | $610,200 +8.9% |
| 2024 | $9,583 -8.1% | $560,100 -0.2% |
| 2023 | $10,429 +11.7% | $561,000 +25.5% |
| 2022 | $9,335 -2.1% | $447,100 +7.3% |
| 2021 | $9,532 +3.7% | $416,600 +5.8% |
| 2020 | $9,189 +5.9% | $393,800 +1.1% |
| 2019 | $8,677 | $389,700 +6.4% |
| 2018 | $8,677 +3.3% | $366,100 +4.1% |
| 2017 | $8,403 +8.5% | $351,700 +1.6% |
| 2016 | $7,745 -1.1% | $346,100 +9.7% |
| 2015 | $7,829 -0.9% | $315,600 +6.6% |
| 2014 | $7,900 +0.1% | $296,100 |
| 2013 | $7,894 +3.3% | $296,100 |
| 2012 | $7,640 +1.7% | $296,100 -17.3% |
| 2011 | $7,515 +3.9% | $358,200 |
| 2010 | $7,232 +2.1% | $358,200 |
| 2009 | $7,082 | $358,200 |
| 2008 | -- | $358,200 |
| 2007 | -- | $358,200 +99.2% |
| 2006 | -- | $179,800 |
| 2005 | -- | $179,800 |
| 2003 | -- | $179,800 |
| 2002 | -- | $179,800 |
| 2001 | -- | $179,800 |
Find assessor info on the county website
BuyAbility℠ payment
Estimated monthly payment
Boost your down payment with 6% savings match
Earn up to a 6% match & get a competitive APY with a *. Zillow has partnered with to help get you home faster.
Learn more*Terms apply. Match provided by Foyer. Account offered by Pacific West Bank, Member FDIC.Climate risks
Neighborhood: Ramtown
Nearby schools
GreatSchools rating
- 5/10Ramtown Elementary SchoolGrades: 3-5Distance: 0.4 mi
- 5/10Howell Twp M S SouthGrades: 6-8Distance: 0.6 mi
- 5/10Howell High SchoolGrades: 9-12Distance: 5.1 mi