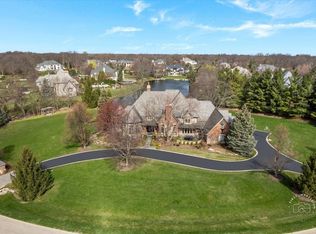
$850,800
4 bd|3 ba|4k sqft
36W290 Crane Rd, St Charles, IL 60175
Off Market
Zillow last checked: 8 hours ago
Listing updated: February 09, 2026 at 10:07pm
Gwendolyn James 773-637-6500,
Weichert, Realtors - All Pro
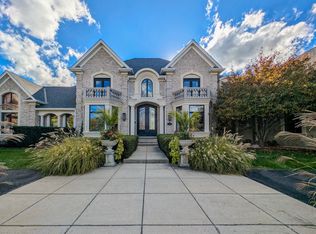
$2,667,800
$2.53M - $2.80M
$7,064/mo
| Date | Event | Price |
|---|---|---|
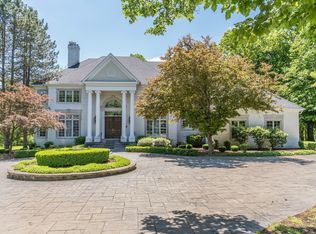
| 2/5/2026 | Price change | $2,850,000-7.6%$284/sqft |
Source: | ||
| 10/14/2025 | Listed for sale | $3,085,000+134.6%$308/sqft |
Source: | ||
| 6/26/2025 | Sold | $1,315,000-11.7%$131/sqft |
Source: | ||
| 5/22/2025 | Contingent | $1,490,000$149/sqft |
Source: | ||
| 4/26/2025 | Listed for sale | $1,490,000$149/sqft |
Source: | ||
| 4/12/2025 | Contingent | $1,490,000$149/sqft |
Source: | ||
| 4/3/2025 | Listed for sale | $1,490,000+27.9%$149/sqft |
Source: | ||
| 1/31/2024 | Sold | $1,165,000-2.5%$116/sqft |
Source: | ||
| 12/18/2023 | Contingent | $1,195,000$119/sqft |
Source: | ||
| 11/1/2023 | Price change | $1,195,000-7.7%$119/sqft |
Source: | ||
| 7/25/2023 | Price change | $1,295,000-7.2%$129/sqft |
Source: | ||
| 6/21/2023 | Listed for sale | $1,395,000+50%$139/sqft |
Source: | ||
| 4/11/2018 | Sold | $930,000-6.1%$93/sqft |
Source: Public Record Report a problem | ||
| 4/11/2018 | Listed for sale | $989,900$99/sqft |
Source: Coldwell Banker Residential #09490471 Report a problem | ||
| 2/12/2018 | Pending sale | $989,900$99/sqft |
Source: Coldwell Banker Residential Brokerage - St Charles #09490471 Report a problem | ||
| 10/31/2017 | Price change | $989,900-0.5%$99/sqft |
Source: Coldwell Banker Residential Brokerage - St Charles #09490471 Report a problem | ||
| 7/18/2017 | Price change | $995,000-13.5%$99/sqft |
Source: Coldwell Banker Residential Brokerage - St Charles #09490471 Report a problem | ||
| 6/10/2017 | Price change | $1,150,000-17.6%$115/sqft |
Source: Coldwell Banker Residential Brokerage - St Charles #09490471 Report a problem | ||
| 1/31/2017 | Listed for sale | $1,395,000-7%$139/sqft |
Source: Coldwell Banker Residential Brokerage - St Charles #09490471 Report a problem | ||
| 9/27/2016 | Listing removed | $1,500,000$150/sqft |
Source: RE/MAX Excels #09143482 Report a problem | ||
| 2/19/2016 | Listed for sale | $1,500,000-8.8%$150/sqft |
Source: RE/MAX Excels #09143482 Report a problem | ||
| 11/10/2015 | Listing removed | $1,645,000+58.9%$164/sqft |
Source: RE/MAX Excels #08627238 Report a problem | ||
| 7/29/2015 | Sold | $1,035,000-37.1%$103/sqft |
Source: Public Record Report a problem | ||
| 5/29/2014 | Price change | $1,645,000-17.5%$164/sqft |
Source: RE/MAX Excels #08627238 Report a problem | ||
| 3/12/2013 | Price change | $1,995,000-8.3%$199/sqft |
Source: RE/MAX Excels #08288888 Report a problem | ||
| 7/9/2011 | Listed for sale | $2,175,000+574.4%$217/sqft |
Source: RE/MAX Excels #07852130 Report a problem | ||
| 3/29/1999 | Sold | $322,500$32/sqft |
Source: Public Record Report a problem | ||
| Year | Property taxes | Tax assessment |
|---|---|---|
| 2024 | $36,152 +4.4% | $507,873 +11.7% |
| 2023 | $34,617 +2.5% | $454,553 +4.8% |
| 2022 | $33,773 +4.8% | $433,854 +4.9% |
| 2021 | $32,212 +6.2% | $413,549 +1.9% |
| 2020 | $30,325 +1.8% | $405,838 +2% |
| 2019 | $29,789 -1.3% | $397,803 +4.8% |
| 2018 | $30,189 +8.8% | $379,608 +3.5% |
| 2017 | $27,737 -24.2% | $366,630 -14.5% |
| 2016 | $36,568 | $429,049 +9.4% |
| 2015 | -- | $392,022 +8.9% |
| 2014 | -- | $359,852 -1.8% |
| 2013 | -- | $366,281 -7.3% |
| 2012 | -- | $395,082 -21% |
| 2011 | -- | $500,202 -7% |
| 2010 | -- | $537,963 -2.6% |
| 2009 | -- | $552,600 -2.5% |
| 2008 | -- | $567,028 +9.5% |
| 2007 | -- | $517,629 +3% |
| 2006 | -- | $502,749 -1.9% |
| 2005 | -- | $512,722 +4.5% |
| 2004 | -- | $490,482 +16.1% |
| 2003 | -- | $422,627 +1.2% |
| 2002 | -- | $417,759 +2.2% |
| 2001 | -- | $408,625 +151.2% |
| 2000 | -- | $162,652 |
Find assessor info on the county website
Source: MRED as distributed by MLS GRID. This data may not be complete. We recommend contacting the local school district to confirm school assignments for this home.