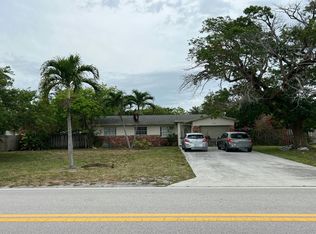
This 1766 square foot single family home has 3 bedrooms and 2.0 bathrooms. This home is located at 469 NE 35th St, Boca Raton, FL 33431.
Pre-foreclosure
Est. $664,900
469 NE 35th St, Boca Raton, FL 33431
3beds
2baths
1,766sqft
SingleFamily
Built in 1959
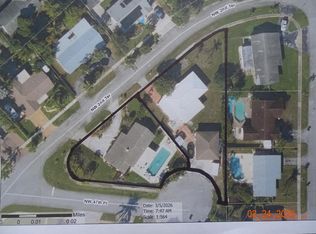
2,195 Square Feet Lot
$664,900 Zestimate®
$377/sqft
$-- HOA
Overview
- 258 days |
- 58 |
- 3 |
Facts & features
Interior
Bedrooms & bathrooms
- Bedrooms: 3
- Bathrooms: 2
Heating
- Forced air
Cooling
- Other
Appliances
- Included: Dishwasher, Dryer, Washer
- Laundry: In Unit
Features
- Flooring: Carpet
- Furnished: Yes
Interior area
- Total interior livable area: 1,766 sqft
Property
Parking
- Parking features: Off-street, Garage
Features
- Exterior features: Stucco
Lot
- Size: 2,195 Square Feet
Details
- Parcel number: 06434708040540231
Construction
Type & style
- Home type: SingleFamily
Materials
- masonry
- Roof: Tile
Condition
- Year built: 1959
Community & HOA
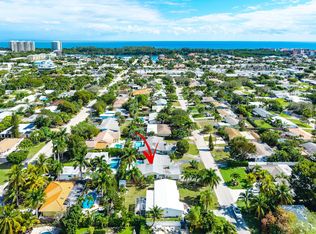
Location
- Region: Boca Raton
Financial & listing details
- Price per square foot: $377/sqft
- Tax assessed value: $502,707
- Annual tax amount: $8,901
Visit our professional directory to find a foreclosure specialist in your area that can help with your home search.
Find a foreclosure agentForeclosure details
Estimated market value
$664,900
$585,000 - $758,000
$4,233/mo
Price history
Price history
| Date | Event | Price |
|---|---|---|
| 7/27/2024 | Listing removed | -- |
Source: Zillow Rentals Report a problem | ||
| 3/15/2024 | Listed for rent | $5,500+10%$3/sqft |
Source: Zillow Rentals Report a problem | ||
| 10/29/2023 | Listing removed | -- |
Source: Zillow Rentals Report a problem | ||
| 10/1/2023 | Listed for rent | $5,000$3/sqft |
Source: Zillow Rentals Report a problem | ||
| 9/1/2023 | Listing removed | -- |
Source: Zillow Rentals Report a problem | ||
| 3/22/2023 | Listed for rent | $5,000$3/sqft |
Source: Zillow Rentals Report a problem | ||
| 3/10/2023 | Listing removed | -- |
Source: Zillow Rentals Report a problem | ||
| 1/26/2023 | Listed for rent | $5,000-13%$3/sqft |
Source: Zillow Rentals Report a problem | ||
| 10/26/2022 | Listing removed | -- |
Source: Zillow Rental Manager Report a problem | ||
| 9/9/2022 | Price change | $5,750+21.1%$3/sqft |
Source: Zillow Rental Manager Report a problem | ||
| 8/6/2022 | Price change | $4,750-14.4%$3/sqft |
Source: Zillow Rental Manager Report a problem | ||
| 7/24/2022 | Price change | $5,550-6.7%$3/sqft |
Source: Zillow Rental Manager Report a problem | ||
| 7/14/2022 | Price change | $5,950-8.5%$3/sqft |
Source: Zillow Rental Manager Report a problem | ||
| 6/13/2022 | Listed for rent | $6,500$4/sqft |
Source: Zillow Rental Manager Report a problem | ||
| 5/24/2022 | Sold | $431,000+13.5%$244/sqft |
Source: Public Record Report a problem | ||
| 8/2/2018 | Listing removed | $379,900$215/sqft |
Source: United Realty Group Inc #F10122086 Report a problem | ||
| 6/1/2018 | Price change | $379,900-5%$215/sqft |
Source: United Realty Group Inc #F10122086 Report a problem | ||
| 5/10/2018 | Listed for sale | $399,900$226/sqft |
Source: United Realty Group Inc #F10122086 Report a problem | ||
Public tax history
Public tax history
| Year | Property taxes | Tax assessment |
|---|---|---|
| 2024 | $8,901 -5.7% | $502,707 -5.1% |
| 2023 | $9,436 +15% | $529,953 +18.3% |
| 2022 | $8,204 +275.5% | $447,894 +198% |
| 2021 | $2,185 +1.8% | $150,297 +1.4% |
| 2020 | $2,147 +1.5% | $148,222 +2.3% |
| 2019 | $2,114 | $144,890 +1.9% |
| 2018 | $2,114 +6.3% | $142,188 +2.1% |
| 2017 | $1,989 +1.7% | $139,263 +2.1% |
| 2016 | $1,955 +1.3% | $136,399 +0.7% |
| 2015 | $1,929 -1.8% | $135,451 +0.8% |
| 2014 | $1,964 +1.8% | $134,376 +1.5% |
| 2013 | $1,930 -5.5% | $132,390 +1.7% |
| 2012 | $2,041 +2.6% | $130,177 +3% |
| 2011 | $1,989 +10.3% | $126,385 +1.5% |
| 2010 | $1,803 +8.9% | $124,517 +2.7% |
| 2009 | $1,655 +2.2% | $121,243 +0.1% |
| 2008 | $1,619 -8.9% | $121,122 +3% |
| 2007 | $1,778 -5% | $117,594 +2.5% |
| 2006 | $1,872 | $114,726 +3% |
| 2005 | -- | $111,384 +3% |
| 2004 | $925 +789% | $108,140 +1.9% |
| 2003 | $104 -94% | $106,124 +2.4% |
| 2002 | $1,728 +0.3% | $103,637 +1.6% |
| 2001 | $1,723 +4.1% | $102,005 +3% |
| 2000 | $1,655 +14.7% | $99,034 -2.1% |
| 1999 | $1,443 | $101,134 |
Find assessor info on the county website
Monthly payment
Estimated monthly payment
All calculations are estimates and provided by Zillow, Inc. for informational purposes only. Actual amounts may vary.
HOA fees may include property taxes on listings classified as Co-Ops. Contact the listing agent and/or owner for fee details.
Mortgage interest rates are dependent on a number of factors, including credit score, down payment, and repayment length. Interest rate data provided by Zillow Group Marketplace, Inc. as of 1/1/1970 from various mortgage lenders with which we have lead or other similar arrangements; the Estimated Payment is an average of those rates.
See how much you could borrow to make a competitive offer.
Climate risks
Neighborhood: 33431
Nearby schools
GreatSchools rating
- 4/10J. C. Mitchell Elementary SchoolGrades: PK-5Distance: 1 mi
- 8/10Boca Raton Community Middle SchoolGrades: 6-8Distance: 2.6 mi
- 6/10Boca Raton Community High SchoolGrades: 9-12Distance: 2.6 mi


- Florida
- Palm Beach County
- Boca Raton
- 33431
- 469 NE 35th St
Nearby cities
Nearby neighborhoods
Nearby zip codes
Other Boca Raton Topics
