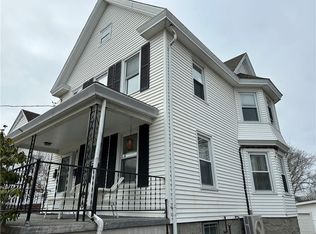
This 1479 square foot single family home has 3 bedrooms and 2.0 bathrooms. This home is located at 45 School St, Westerly, RI 02891.
Foreclosed
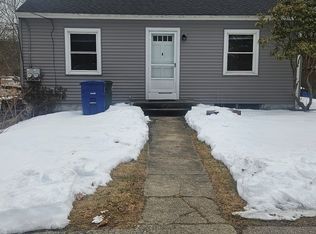
Street View
Est. $278,800
45 School St, Westerly, RI 02891
3beds
2baths
1,479sqft
SingleFamily
Built in 1896
5,227 Square Feet Lot
$278,800 Zestimate®
$189/sqft
$-- HOA
Overview
- 41 days |
- 125 |
- 3 |
Facts & features
Interior
Bedrooms & bathrooms
- Bedrooms: 3
- Bathrooms: 2
Heating
- Other, Gas
Interior area
- Total interior livable area: 1,479 sqft
Property
Features
- Exterior features: Other
Lot
- Size: 5,227 Square Feet
Details
- Parcel number: WESTM67B58
Construction
Type & style
- Home type: SingleFamily
- Architectural style: Conventional
Materials
- Roof: Asphalt
Condition
- Year built: 1896
Community & HOA
Location
- Region: Westerly
Financial & listing details
- Price per square foot: $189/sqft
- Tax assessed value: $370,700
- Annual tax amount: $2,884
Visit our professional directory to find a foreclosure specialist in your area that can help with your home search.
Find a foreclosure agentForeclosure details
Estimated market value
$278,800
$223,000 - $349,000
$2,702/mo
Price history
Price history
| Date | Event | Price |
|---|---|---|
| 1/20/2026 | Sold | $103,171-8.7%$70/sqft |
Source: Public Record Report a problem | ||
| 7/26/1999 | Sold | $113,000$76/sqft |
Source: Public Record Report a problem | ||
Public tax history
Public tax history
| Year | Property taxes | Tax assessment |
|---|---|---|
| 2025 | $2,884 -2.5% | $370,700 +30.9% |
| 2024 | $2,959 +3.5% | $283,200 |
| 2023 | $2,860 | $283,200 |
| 2022 | $2,860 +0% | $283,200 +19.4% |
| 2021 | $2,859 +1.7% | $237,100 |
| 2020 | $2,810 +0.9% | $237,100 |
| 2019 | $2,784 +5.5% | $237,100 +10.9% |
| 2018 | $2,639 +2.9% | $213,700 |
| 2017 | $2,564 | $213,700 |
| 2016 | $2,564 +4.4% | $213,700 -2.3% |
| 2015 | $2,457 +1.6% | $218,800 |
| 2014 | $2,418 +1.4% | $218,800 |
| 2013 | $2,385 -2.6% | $218,800 -9.7% |
| 2012 | $2,449 +1% | $242,200 |
| 2011 | $2,424 +3.2% | $242,200 |
| 2010 | $2,349 -0.9% | $242,200 -9.4% |
| 2009 | $2,370 | $267,200 |
| 2008 | $2,370 +3.1% | $267,200 |
| 2007 | $2,298 +9.6% | $267,200 +36.5% |
| 2006 | $2,097 +4.1% | $195,800 +0.1% |
| 2005 | $2,015 +11.8% | $195,600 +66.6% |
| 2003 | $1,802 | $117,400 |
Find assessor info on the county website
BuyAbility℠ payment
Estimated monthly payment
Boost your down payment with 6% savings match
Earn up to a 6% match & get a competitive APY with a *. Zillow has partnered with to help get you home faster.
Learn more*Terms apply. Match provided by Foyer. Account offered by Pacific West Bank, Member FDIC.Climate risks
Neighborhood: 02891
Nearby schools
GreatSchools rating
- 9/10State Street SchoolGrades: K-4Distance: 0.5 mi
- 6/10Westerly Middle SchoolGrades: 5-8Distance: 2.6 mi
- 7/10Westerly High SchoolGrades: 9-12Distance: 0.4 mi