$158,600
1 bd|1 ba|726 sqft
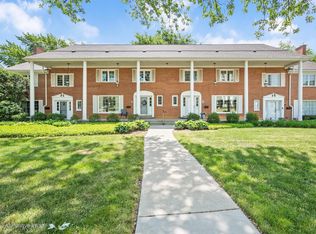
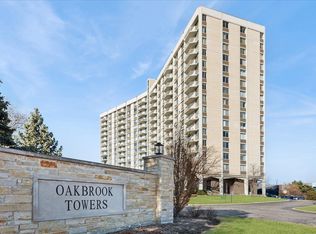
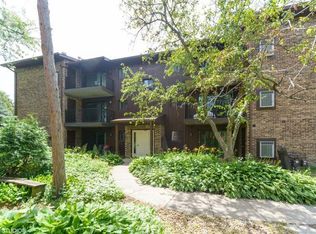
40 N Tower Rd APT 6J, Oak Brook, IL 60523
Off Market
Likely to sell faster than
Zillow last checked: 8 hours ago
Listing updated: February 22, 2026 at 12:39am
Coya J Smith 708-903-5110,
RE/MAX Premier
Not available
Estimated sales range
Not available
Not available
| Date | Event | Price |
|---|---|---|
| 2/20/2026 | Listed for sale | $249,900+36.6%$194/sqft |
Source: | ||
| 3/4/2022 | Sold | $183,000-3.7%$142/sqft |
Source: | ||
| 11/5/2021 | Contingent | $190,000$148/sqft |
Source: | ||
| 10/27/2021 | Price change | $190,000-5%$148/sqft |
Source: | ||
| 9/24/2021 | Listed for sale | $200,000+48.1%$156/sqft |
Source: | ||
| 7/15/2016 | Sold | $135,000-9.9%$105/sqft |
Source: | ||
| 6/20/2016 | Pending sale | $149,900$117/sqft |
Source: L.W. Reedy Real Estate #09162432 Report a problem | ||
| 6/7/2016 | Price change | $149,900-6%$117/sqft |
Source: L.W. Reedy Real Estate #09162432 Report a problem | ||
| 5/7/2016 | Pending sale | $159,500$124/sqft |
Source: L.W. Reedy Real Estate #09162432 Report a problem | ||
| 4/11/2016 | Price change | $159,500-0.3%$124/sqft |
Source: L.W. Reedy Real Estate #09162432 Report a problem | ||
| 3/11/2016 | Listed for sale | $159,900+23.1%$124/sqft |
Source: L.W. Reedy Real Estate #09162432 Report a problem | ||
| 4/10/2011 | Listing removed | $129,900$101/sqft |
Source: RE/MAX of Naperville/Enterprises #07244693 Report a problem | ||
| 2/26/2011 | Listed for sale | $129,900$101/sqft |
Source: RE/MAX of Naperville/Enterprises #07244693 Report a problem | ||
| 2/17/2011 | Pending sale | $129,900$101/sqft |
Source: RE/MAX of Naperville/Enterprises #07244693 Report a problem | ||
| 1/16/2011 | Listed for sale | $129,900+10.1%$101/sqft |
Source: RE/MAX of Naperville/Enterprises #07244693 Report a problem | ||
| 6/10/1997 | Sold | $118,000-1.7%$92/sqft |
Source: Public Record Report a problem | ||
| 10/10/1995 | Sold | $120,000$93/sqft |
Source: Public Record Report a problem | ||
| Year | Property taxes | Tax assessment |
|---|---|---|
| 2024 | $4,134 +7.1% | $63,694 +8.1% |
| 2023 | $3,861 +14.1% | $58,900 +14.1% |
| 2022 | $3,383 +3.8% | $51,600 +2.6% |
| 2021 | $3,259 +2.3% | $50,310 +2.2% |
| 2020 | $3,186 -4.8% | $49,210 -4.5% |
| 2019 | $3,345 +14.4% | $51,510 +17.9% |
| 2018 | $2,925 +10.6% | $43,700 +10.2% |
| 2017 | $2,644 +1.3% | $39,650 +6.2% |
| 2016 | $2,611 +3% | $37,350 +7.4% |
| 2015 | $2,534 -3.5% | $34,790 -2.2% |
| 2014 | $2,626 +1.7% | $35,590 -1.4% |
| 2013 | $2,583 +2% | $36,090 -6.2% |
| 2012 | $2,533 -17.1% | $38,470 -24.5% |
| 2011 | $3,054 -5% | $50,940 -11.2% |
| 2010 | $3,215 +2.6% | $57,390 -6.8% |
| 2009 | $3,132 +1.8% | $61,580 |
| 2008 | $3,077 +6.8% | $61,580 +8.8% |
| 2007 | $2,881 -0.3% | $56,600 +1.4% |
| 2006 | $2,889 +6% | $55,810 +6.9% |
| 2005 | $2,725 +7.5% | $52,210 +6.3% |
| 2004 | $2,534 +5.2% | $49,110 +10.1% |
| 2003 | $2,407 +2.1% | $44,600 +4.1% |
| 2002 | $2,359 +3.9% | $42,830 +8.7% |
| 2001 | $2,270 +2.2% | $39,390 +5.2% |
| 2000 | $2,222 | $37,450 |
Find assessor info on the county website
Source: MRED as distributed by MLS GRID. This data may not be complete. We recommend contacting the local school district to confirm school assignments for this home.