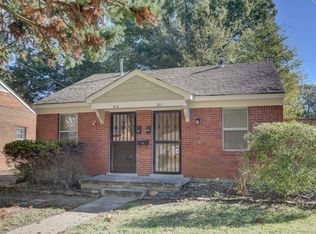
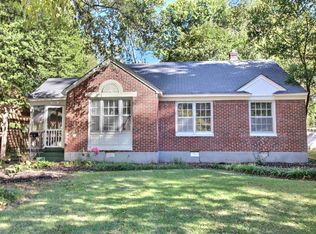
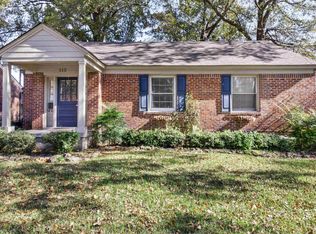
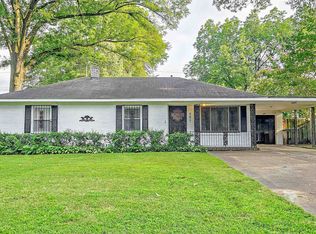
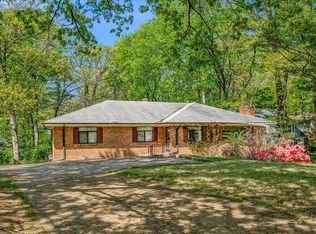
Great investment opportunity! Property has long been stabilized with long term tenants. Property also has new roof. Easy turnkey opportunity. Call agent for showings. Rents are $800 and $850 for 1 bed rooms, and $750 for the studio. Cash offers only- property is currently legal non conforming use and needs a special use permit.
For sale
$250,000
370 S Fenwick Rd, Memphis, TN 38111
--beds
--baths
1,641sqft
Est.:
Multi Family
Built in 1958
-- sqft lot
$-- Zestimate®
$152/sqft
$-- HOA
What's special
New roof
- 30 days |
- 194 |
- 7 |
Zillow last checked:
Listing updated:
Listed by:
Worth W Woodyard,
Woodyard Realty Corp 901-767-1998
Source: MAAR,MLS#: 10212706
Tour with a local agent
Facts & features
Interior
Heating
- Central
Cooling
- Central Air
Appliances
- Included: Gas Water Heater
- Laundry: Connections, None
Features
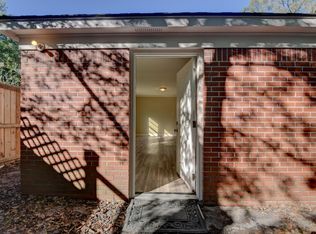
- Flooring: Hardwood, Tile
Interior area
- Total interior livable area: 1,641 sqft
Property
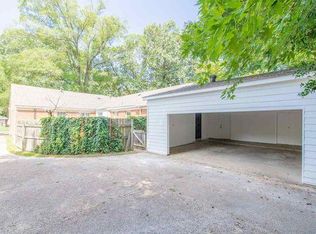
Parking
- Parking features: Concrete
Features
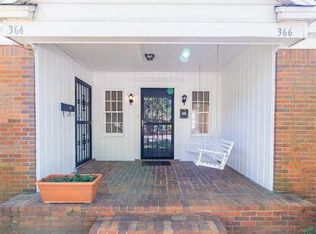
- Stories: 1
Lot
- Size: 5,625 Square Feet
- Dimensions: 45 x 125
Details
- Parcel number: 045041 00044
Construction
Type & style
- Home type: MultiFamily
- Property subtype: Multi Family
Materials
- Brick
- Foundation: Slab
- Roof: Composition,Pitched
Condition
- Year built: 1958
Community & HOA
Community
- Subdivision: Dlugachs Central Avenue
Location
- Region: Memphis
Financial & listing details
- Price per square foot: $152/sqft
- Tax assessed value: $216,500
- Annual tax amount: $4,565
- Date on market: 3/20/2026
- Cumulative days on market: 42 days
- Listing terms: Conventional
- Inclusions: No Furnishings, All Appliances
- Lease term: 12 Months
- Tenant pays: All Utilities
Estimated market value
Not available
Estimated sales range
Not available
$1,291/mo
Price history
| Date | Event | Price |
|---|---|---|
| 3/20/2026 | Listed for sale | $250,000$152/sqft |
Source: | ||
| 3/5/2026 | Listing removed | $250,000$152/sqft |
Source: | ||
| 1/26/2026 | Pending sale | $250,000$152/sqft |
Source: | ||
| 1/12/2026 | Listed for sale | $250,000+19%$152/sqft |
Source: | ||
| 10/7/2025 | Listing removed | $800 |
Source: Zillow Rentals Report a problem | ||
| 8/20/2025 | Listed for rent | $800-5.9% |
Source: Zillow Rentals Report a problem | ||
| 11/8/2024 | Listing removed | $850$1/sqft |
Source: Zillow Rentals Report a problem | ||
| 10/31/2024 | Listed for rent | $850+6.3%$1/sqft |
Source: Zillow Rentals Report a problem | ||
| 2/25/2021 | Listing removed | -- |
Source: Owner Report a problem | ||
| 11/27/2020 | Listing removed | $800 |
Source: Owner Report a problem | ||
| 11/14/2020 | Price change | $800-5.9% |
Source: Owner Report a problem | ||
| 11/5/2020 | Listed for rent | $850$1/sqft |
Source: Owner Report a problem | ||
| 10/16/2020 | Sold | $210,000+223.8%$128/sqft |
Source: Public Record Report a problem | ||
| 5/1/1995 | Sold | $64,850$40/sqft |
Source: Public Record Report a problem | ||
Public tax history
| Year | Property taxes | Tax assessment |
|---|---|---|
| 2025 | $4,565 +17.6% | $86,600 +46.9% |
| 2024 | $3,883 +8.1% | $58,960 |
| 2023 | $3,592 | $58,960 |
| 2022 | -- | $58,960 |
| 2021 | -- | $58,960 +31.3% |
| 2020 | $1,436 | $44,920 |
| 2019 | $1,436 -21.1% | $44,920 |
| 2018 | $1,819 -45.1% | $44,920 |
| 2017 | $3,316 +112.4% | $44,920 -2.2% |
| 2016 | $1,561 +30.8% | $45,920 |
| 2014 | $1,194 | $45,920 |
| 2013 | -- | $45,920 +22.6% |
| 2012 | -- | $37,440 |
| 2011 | -- | $37,440 |
| 2010 | -- | $37,440 |
| 2009 | -- | $37,440 |
| 2008 | -- | $37,440 |
| 2007 | -- | $37,440 |
| 2006 | -- | $37,440 |
| 2005 | -- | $37,440 +29.5% |
| 2004 | -- | $28,920 |
| 2003 | -- | $28,920 |
| 2002 | -- | $28,920 |
| 2001 | -- | $28,920 +27.1% |
| 2000 | -- | $22,760 |
Find assessor info on the county website
Monthly payment
Est. payment
$1,415/mo
Principal & interest
$1215
Property taxes
$200
More affordability tools
Climate risks
Neighborhood: East Memphis-Colonial-Yorkshire
Nearby schools
GreatSchools rating
- NAHanley Elementary SchoolGrades: PK-5Distance: 0.8 mi
- 5/10Sherwood Middle SchoolGrades: 6-8Distance: 1.9 mi
- 3/10Melrose High SchoolGrades: 9-12Distance: 1.1 mi
A local agent can set up tours, give advice and negotiate with sellers.
A local lender can help you make sure your offer is ready when you are.

Nearby cities
Nearby neighborhoods
- Cordova-Appling Real estate
- Downtown Real estate
- East Memphis-Colonial-Yorkshire Real estate
- Hickory Ridge-South Riverdale Real estate
- Midtown Real estate
- Parkway Village-Oakhaven Real estate
- Raleigh Real estate
- River Oaks-Kirby-Balmoral Real estate
- Shelby Forest-Frayser Real estate
- White Haven-Coro Lake Real estate
Nearby zip codes
Other Memphis Topics
