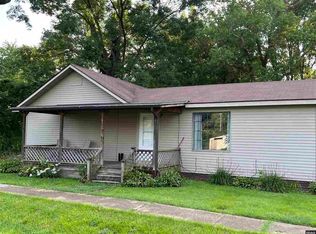
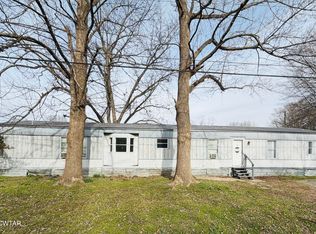
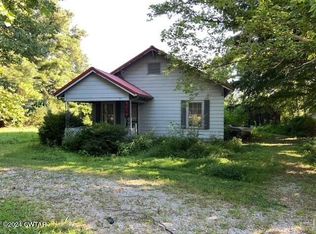
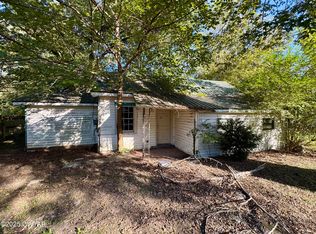
Two mobile homes on one lot The first is a 3 bedroom 2 bath home 924 sq ft with a big nice yard. Needs work but has potential. The second is a 2 bedroom 1 bath and is 896 sq ft and is in good condition, could use a little tlc but is currently occupied. Great Rental Investment. Buyer is responsible for checking square footage and acreage. Listing agency is not responsible for inaccuracies.
Under contract
$34,900
3388-3398 High St, Rives, TN 38253
4beds
2baths
1,820sqft
Est.:
Manufactured Home
Built in 1980
0.36 Acres Lot
$-- Zestimate®
$19/sqft
$-- HOA
What's special
- 277 days |
- 299 |
- 10 |
Zillow last checked: 8 hours ago
Listing updated: December 24, 2025 at 07:25am
Listed by:
CHRISTY DANE 731-571-7654,
TENNESSEE UNITED REAL ESTATE, LLC 731-588-4100
Source: RRAR,MLS#: 45606
Facts & features
Interior
Bedrooms & bathrooms
- Bedrooms: 4
- Bathrooms: 2
Heating
- Central
Cooling
- Central Air
Features
- Flooring: Vinyl
- Windows: Standard No Storm
- Has fireplace: No
- Fireplace features: None
Interior area
- Total interior livable area: 1,820 sqft
Property
Features
- Stories: 1
Lot
- Size: 0.36 Acres
- Features: Level
Details
- Parcel number: 006.00
Construction
Type & style
- Home type: MobileManufactured
- Property subtype: Manufactured Home
Materials
- Vinyl Siding
- Foundation: No Basement
- Roof: Metal
Condition
- Year built: 1980
Utilities & green energy
- Sewer: Public Sewer
- Water: Public
Community & HOA
Location
- Region: Rives
Financial & listing details
- Price per square foot: $19/sqft
- Tax assessed value: $24,600
- Annual tax amount: $165
- Date on market: 5/26/2025
- Road surface type: Paved
- Body type: Single Wide
CHRISTY DANE
(731) 571-7654
By pressing Contact Agent, you agree that the real estate professional identified above may call/text you about your search, which may involve use of automated means and pre-recorded/artificial voices. You don't need to consent as a condition of buying any property, goods, or services. Message/data rates may apply. You also agree to our Terms of Use. Zillow does not endorse any real estate professionals. We may share information about your recent and future site activity with your agent to help them understand what you're looking for in a home.
Estimated market value
Not available
Estimated sales range
Not available
$1,250/mo
Price history
Price history
| Date | Event | Price |
|---|---|---|
| 7/8/2025 | Price change | $34,900-12.5%$19/sqft |
Source: RRAR #45606 Report a problem | ||
| 5/26/2025 | Listed for sale | $39,900+33%$22/sqft |
Source: RRAR #45606 Report a problem | ||
| 4/30/2024 | Sold | $30,000-14.3%$16/sqft |
Source: | ||
| 3/4/2024 | Pending sale | $35,000$19/sqft |
Source: | ||
| 2/9/2024 | Listed for sale | $35,000$19/sqft |
Source: | ||
| 2/5/2024 | Pending sale | $35,000$19/sqft |
Source: | ||
| 1/10/2024 | Listed for sale | $35,000$19/sqft |
Source: | ||
| 1/5/2024 | Pending sale | $35,000$19/sqft |
Source: | ||
| 1/2/2024 | Listed for sale | $35,000+775%$19/sqft |
Source: | ||
| 4/6/2018 | Sold | $4,000-60%$2/sqft |
Source: Public Record Report a problem | ||
| 2/19/2002 | Sold | $10,000$5/sqft |
Source: Public Record Report a problem | ||
Public tax history
Public tax history
| Year | Property taxes | Tax assessment |
|---|---|---|
| 2025 | $165 +0.3% | $6,150 |
| 2024 | $165 -0.8% | $6,150 -0.8% |
| 2023 | $166 -18.1% | $6,200 +17.5% |
| 2022 | $203 +2.4% | $5,275 +2.4% |
| 2021 | $198 +3% | $5,150 +3% |
| 2020 | $192 | $5,000 |
| 2019 | $192 -0.1% | $5,000 |
| 2018 | $193 +358.6% | $5,000 +166.7% |
| 2017 | $42 +10.5% | $1,875 |
| 2016 | $38 -49.4% | $1,875 |
| 2015 | $75 | $1,875 |
| 2014 | $75 | $1,875 |
| 2013 | -- | $1,875 |
| 2012 | $71 | $1,875 +2.7% |
| 2011 | $71 +3.2% | $1,825 |
| 2010 | $69 | $1,825 |
| 2009 | $69 +0% | $1,825 |
| 2008 | $69 | $1,825 |
| 2007 | -- | $1,825 +14.1% |
| 2006 | $67 | $1,600 |
| 2005 | $67 | $1,600 |
| 2004 | $67 | $1,600 |
| 2003 | $67 | $1,600 +0.3% |
| 2001 | -- | $1,596 -83.1% |
| 2000 | -- | $9,458 |
Find assessor info on the county website
BuyAbility℠ payment
Est. payment
$197/mo
Principal & interest
$180
Property taxes
$17
Climate risks
Neighborhood: 38253
Nearby schools
GreatSchools rating
- 6/10Ridgemont Elementary SchoolGrades: PK-8Distance: 1.5 mi
- 5/10Obion County Central High SchoolGrades: 9-12Distance: 6 mi